CueWeb Tutorial
Learn how to use CueWeb’s web interface to monitor jobs, manage frames, and control your OpenCue render farm.
Table of contents
- Overview
- Getting Started
- Monitoring Jobs
- Basic Job Management
- Job Details and Frame Management
- Advanced Search and Filtering
- Table Customization
- Real-time Monitoring
- Mobile and Remote Monitoring
- Submitting a job from CueWeb (CueSubmit tutorial)
- Redirecting cores to a job
- Monitoring the cue (Monitor Cue)
- Managing render hosts (Monitor Hosts)
- Switching Cuebot facilities
- Checking the CueWeb version (About CueWeb)
- Access control: restricted areas
- Reviewing the audit trail (CueWeb Audit)
- Using plugins
- Customizing your workspace
- Troubleshooting Common Issues
Overview
This tutorial will guide you through using CueWeb, OpenCue’s web-based interface. You’ll learn how to monitor jobs, manage frames, search for specific jobs, and perform common render farm operations through your browser.
What you’ll learn
- How to navigate the CueWeb interface
- Job monitoring and management techniques
- Frame-level operations and troubleshooting
- Search and filtering capabilities
- Team collaboration features
Prerequisites
- CueWeb deployed and accessible
- OpenCue render farm with some test jobs
- Basic understanding of render farm concepts
Getting Started
Accessing CueWeb
- Open your web browser
- Navigate to your CueWeb URL (e.g.,
http://cueweb.company.com:3000) - If authentication is enabled, sign in with your credentials
You should see the main CueWeb dashboard with the jobs table.
Interface Overview
The CueWeb interface consists of:
- Global header (persistent across every authenticated route):
- OpenCue logo (theme-aware: black in light mode, white in dark mode) + the CueWeb wordmark on the left, clickable as a link back to the jobs dashboard.
- Six dropdown menus mirroring the CueGUI menu bar:
- File -> Disable Job Interaction (read-only safety toggle).
- Cuebot Facility -> switch between the options (e.g.:
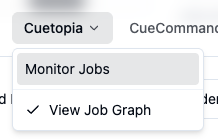
local/dev/cloud/external); the active facility is shown as a chip on the trigger. - Cuetopia -> Monitor Jobs.
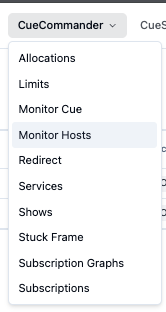
- CueCommander -> Allocations, Limits, Monitor Cue, Monitor Hosts, Redirect, Services, Shows, Stuck Frame, Subscription Graphs, Subscriptions. Routes that are not yet implemented 404 gracefully.
- Other -> Attributes (toggles the docked Attributes panel), Immersive (full-screen) (hides the header, sidebar and status bar; also
F/ Cmd-Ctrl+Shift+F), Split view (open two pages side-by-side), Show Shortcuts (opens the same overlay as?), Notify on Shortcut (toggle for the per-shortcut toast). - Help -> a search box that finds commands across every menu, plus Online User Guide, Make a Suggestion, and Report a Bug.
- Theme toggle and an always-visible Sign out button on the right. With an active session, Sign out clears it and returns you to
/login. Without a session (or when auth is disabled), it simply navigates to/login.
- Left sidebar (persistent, collapsible): same six groups as the header, organized as accordion sections. The group containing the active route auto-expands; click Collapse at the bottom to shrink the sidebar to an icon rail (your choice persists).
- Read-only banner: appears only when Disable Job Interaction is on; describes the read-only state and offers a Re-enable button. Destructive toolbar buttons and right-click menu items are dim and inert in this state.
- Attributes panel: docked drawer toggled from Other ▸ Attributes. Click a row in the jobs table to populate it; use the title-bar position picker to dock it on the right, bottom, left, or top of the viewport.
- Breadcrumb (detail pages only): above the frame log and the per-job comments page, a small “Home > Jobs > …” trail lets you click back to the jobs index or to any parent in the path. Long labels truncate with an ellipsis; hover any segment to see the full text.
- Bottom status bar: fixed 24-pixel bar at the bottom of every page. Shows REST gateway status (a dot + Online/Offline + round-trip latency), the time since the jobs table last refreshed, and the CueWeb build version. The whole bar turns red when the gateway is unreachable.
- Filter Bar: Show selection, status filters, and search
- Jobs Table: Main view of all jobs with sortable columns
- Action Buttons: Job control operations
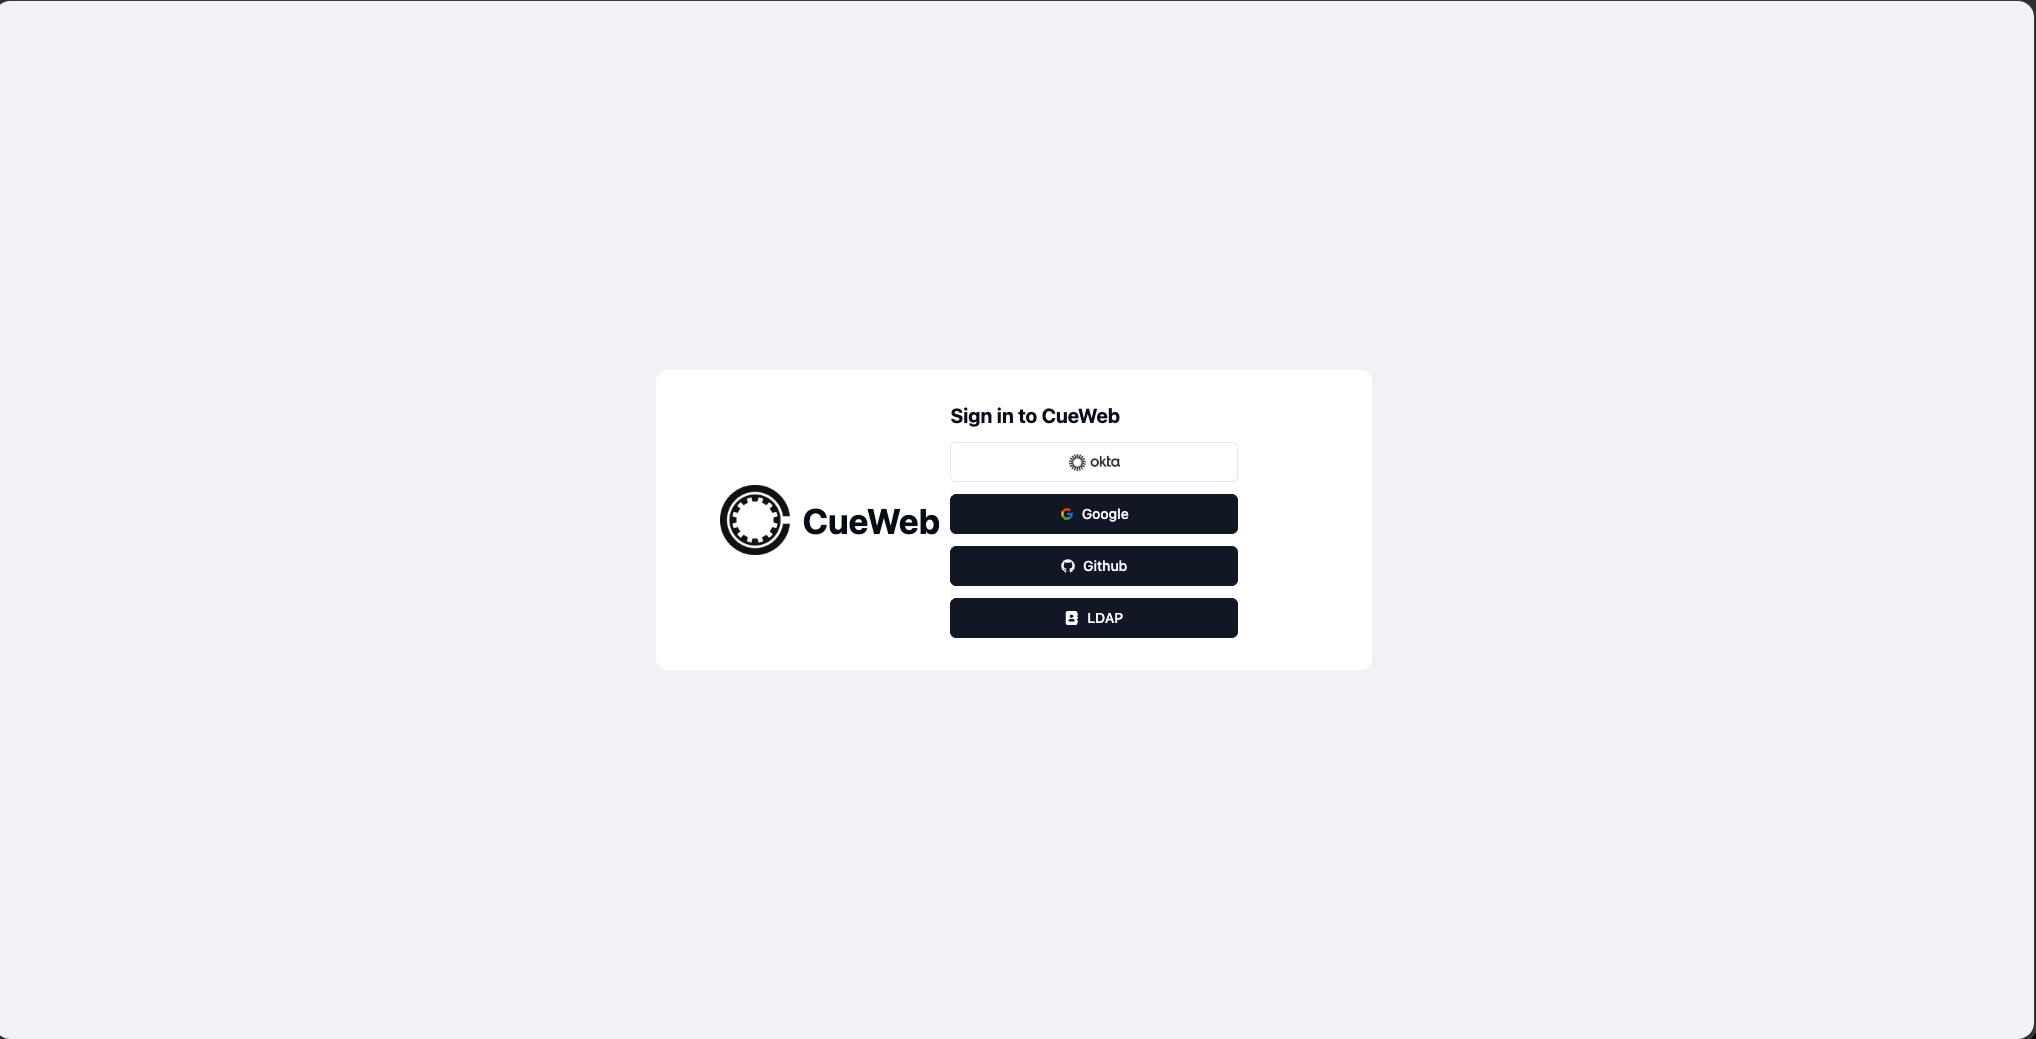
The login page:
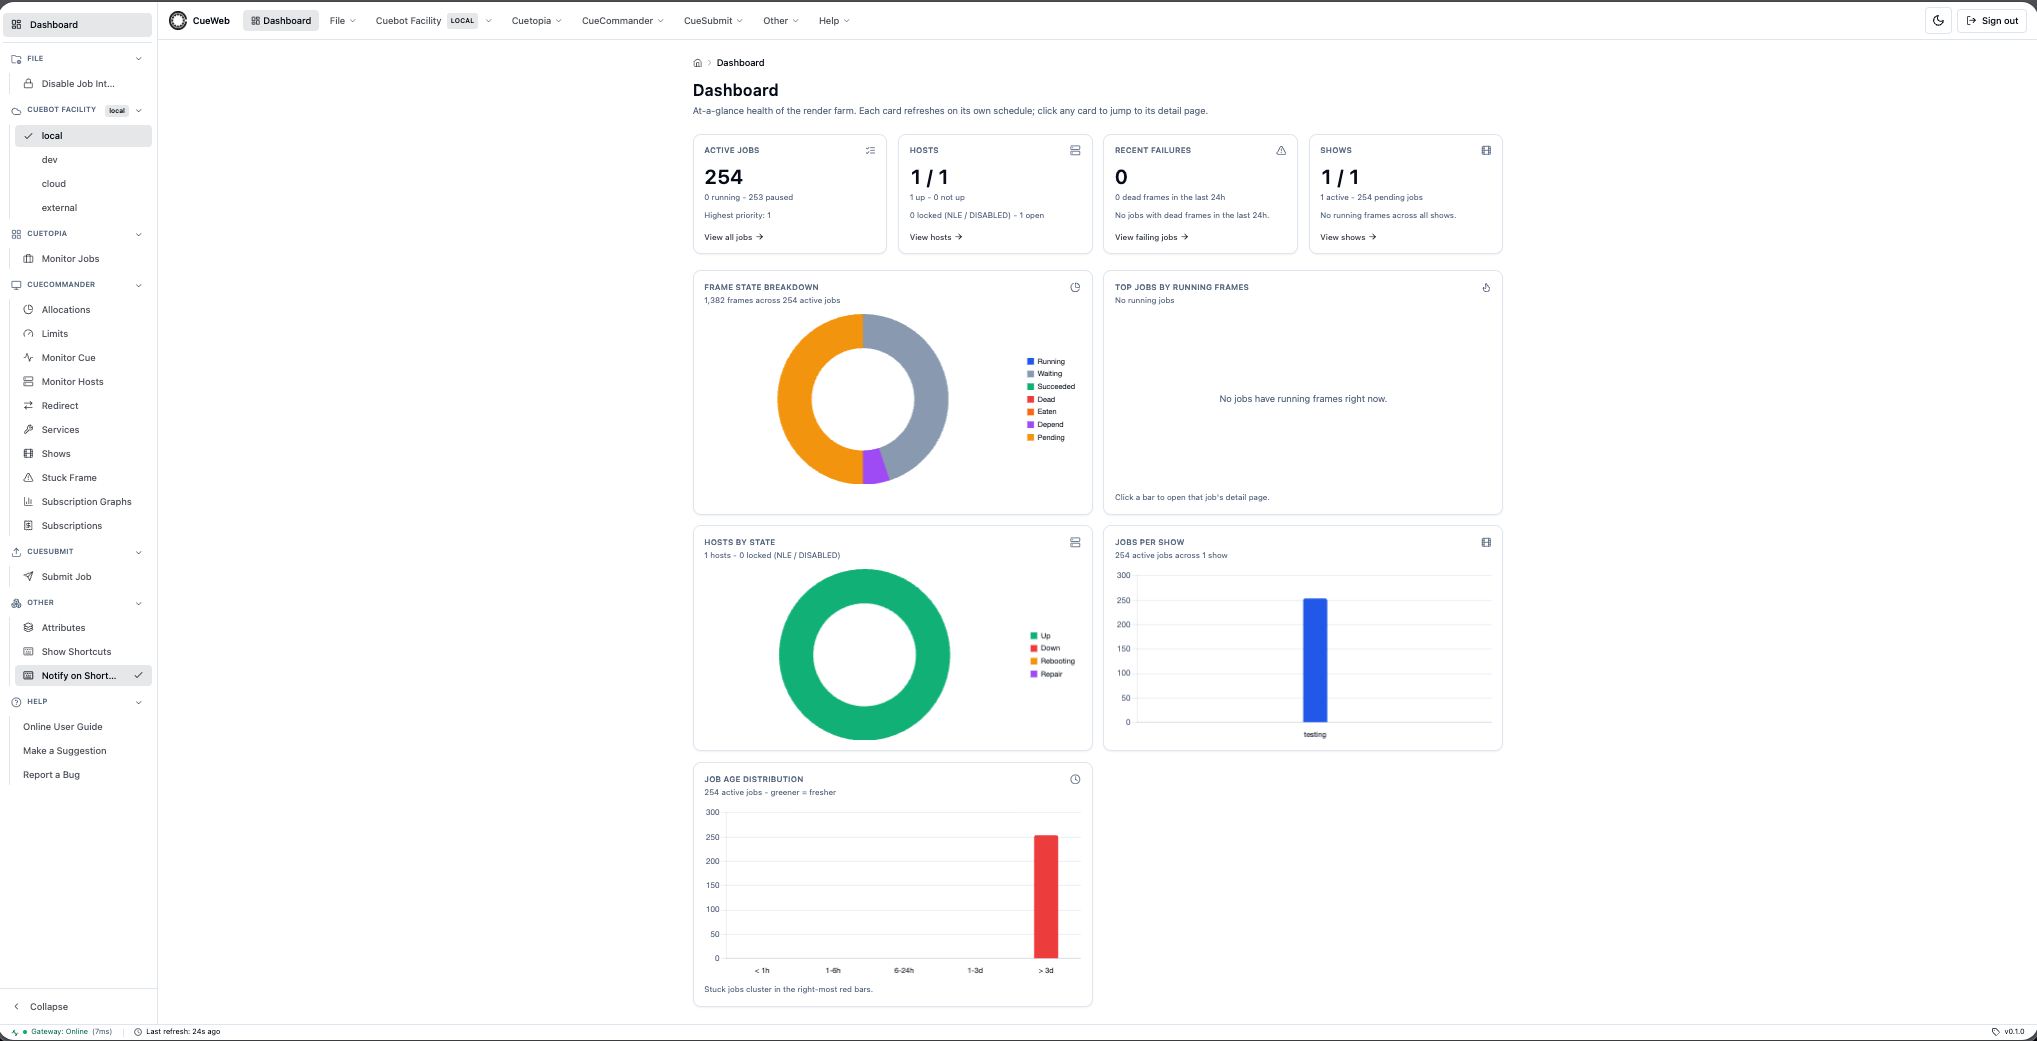
The Dashboard:
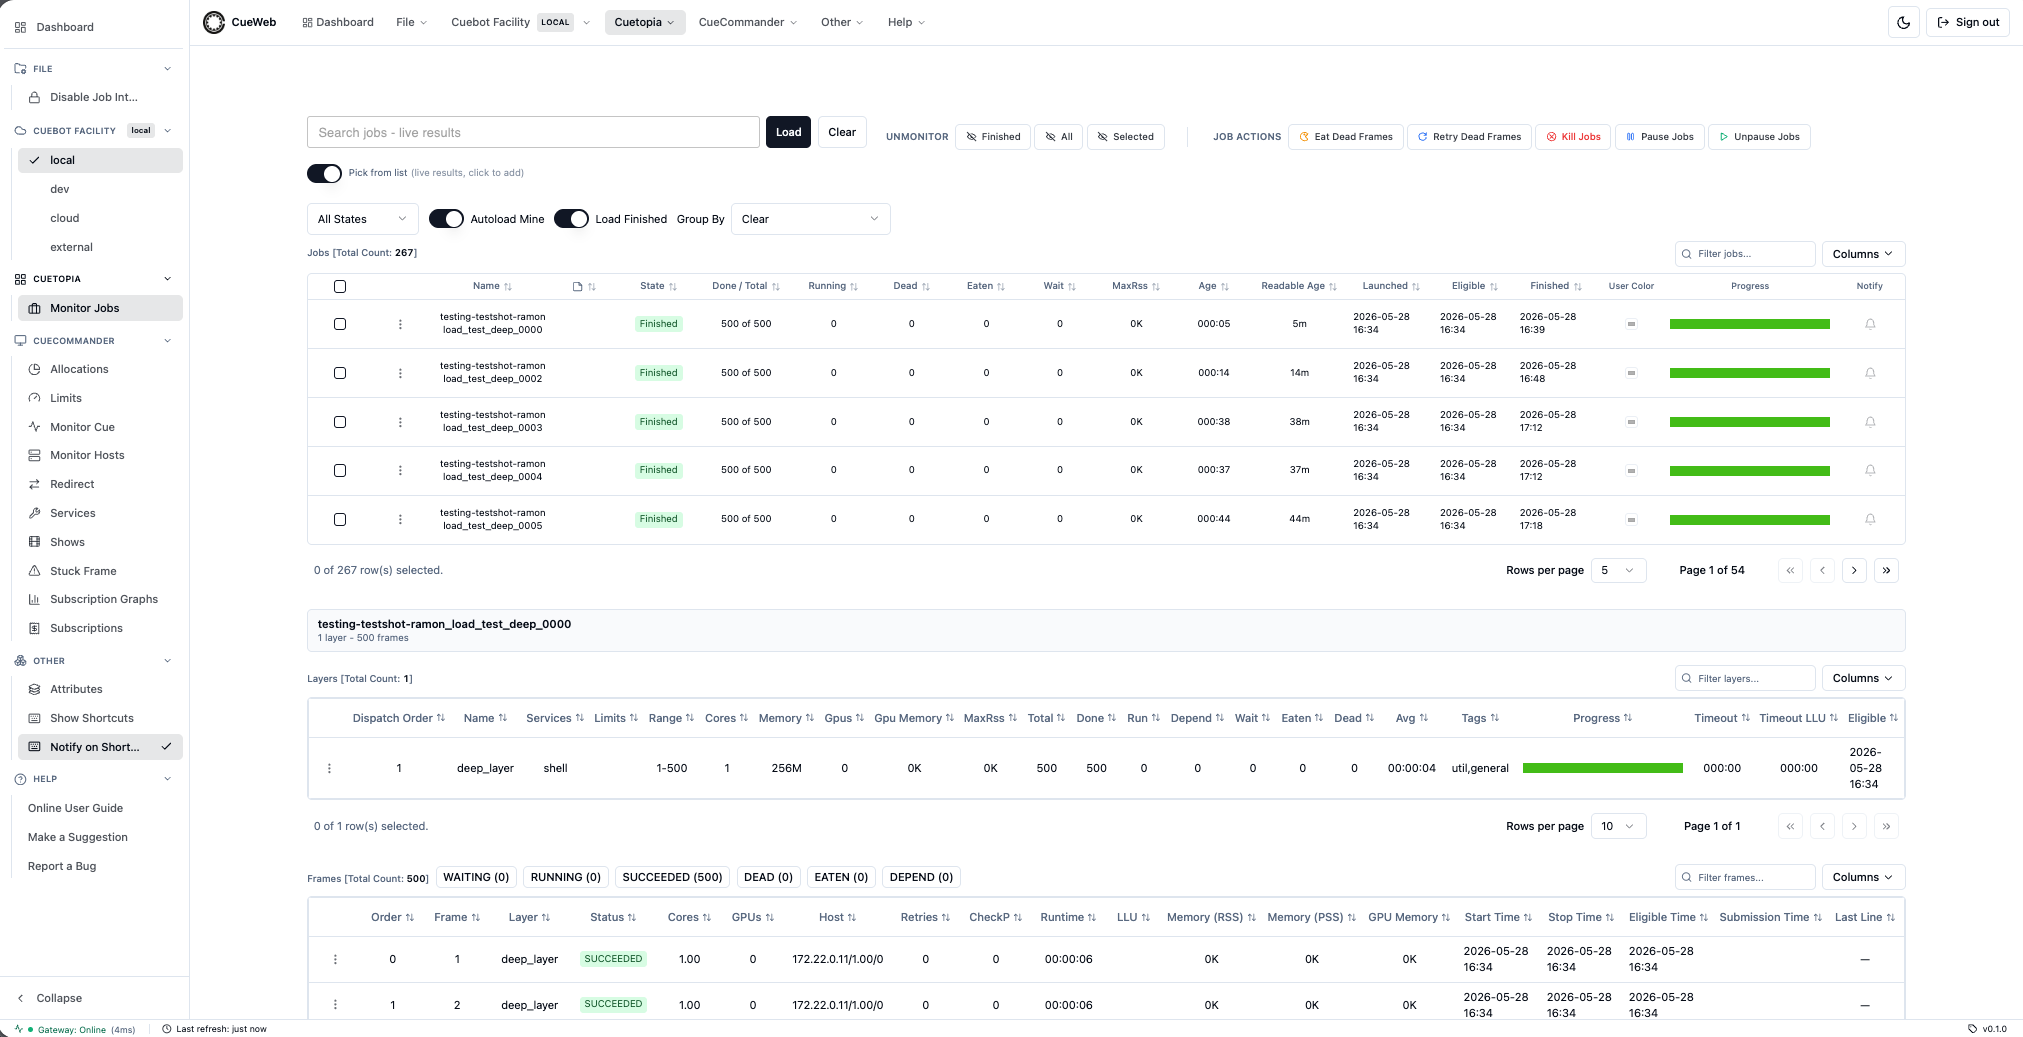
The Cuetopia Monitor Jobs view, with the collapsible left sidebar:
Monitoring Jobs
Viewing Your Jobs
- Select Your Show: Use the show dropdown to filter jobs for your project
- Apply Status Filters: Click filter buttons to show only:
- Active jobs (running or pending)
- Paused jobs
- Failed jobs
- All jobs
- Sort Jobs: Click column headers to sort by:
- Priority (highest first)
- Progress (completion percentage)
- Start time (newest first)
-
Inspect Per-state Progress: Hover the progress bar in the Progress column to display a tooltip with the exact frame count and percentage for each state (succeeded, running, waiting, depend, dead).
- Subscribe to Job Completion - in-browser: Click the bell in the Notify column to subscribe to a notification when a job reaches
FINISHED. The bell cycles through three visual states:- Outline bell → not subscribed
- Filled bell → subscribed, waiting
- Filled bell with green dot → notification has fired (click to clear)
The subscription always succeeds; the OS-level notification permission is requested afterward as an optional upgrade. A toast tells you the outcome -
granted(in-app + desktop popup),denied(in-app only), ordefault(in-app only, user dismissed the prompt). Subscriptions are saved in your browser and survive page reloads, and a background check runs on each subscribed job every 15 seconds. The bell is disabled on jobs that are alreadyFINISHEDwhen first viewed. -
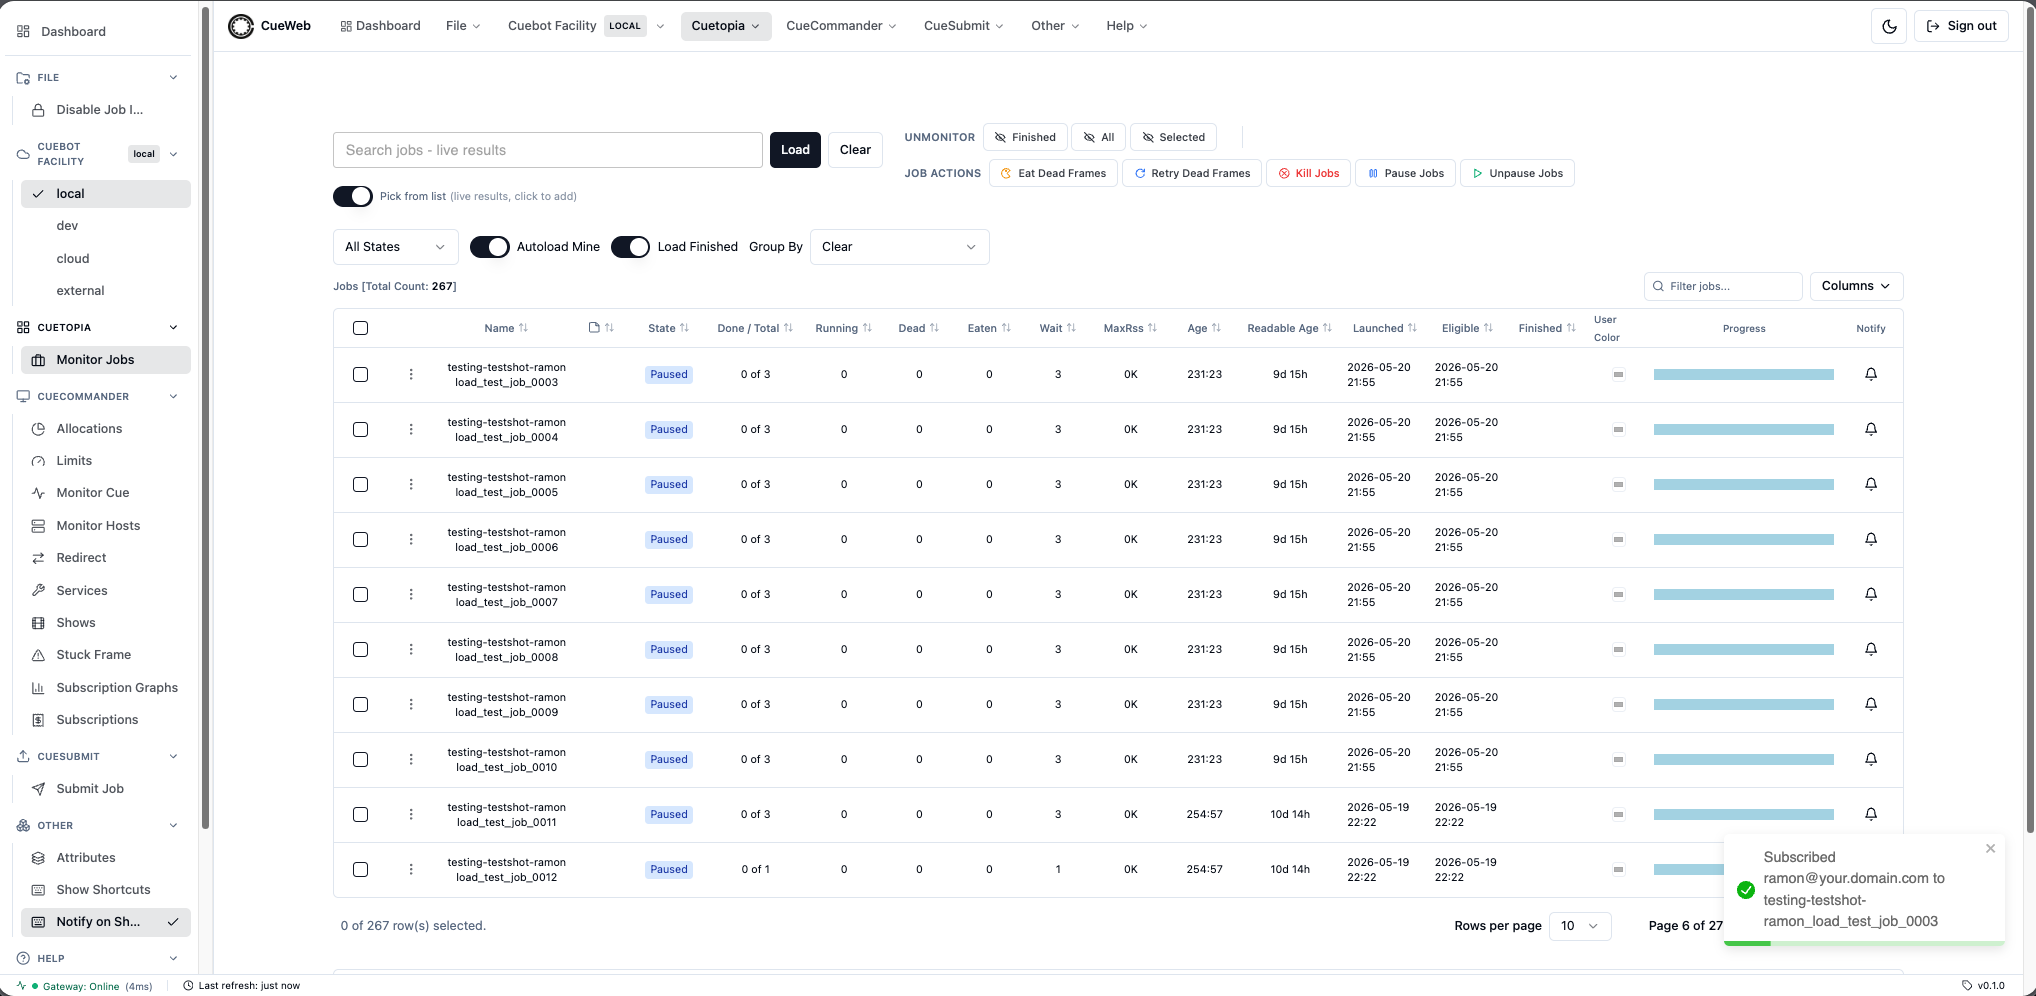
Subscribe to Job Completion - by email: For notifications that survive closing the browser or that should go to a team alias, right-click the job row and pick Subscribe to Job. A small dialog opens with the job name, an informational From address, and an editable To address (pre-filled with your account email).
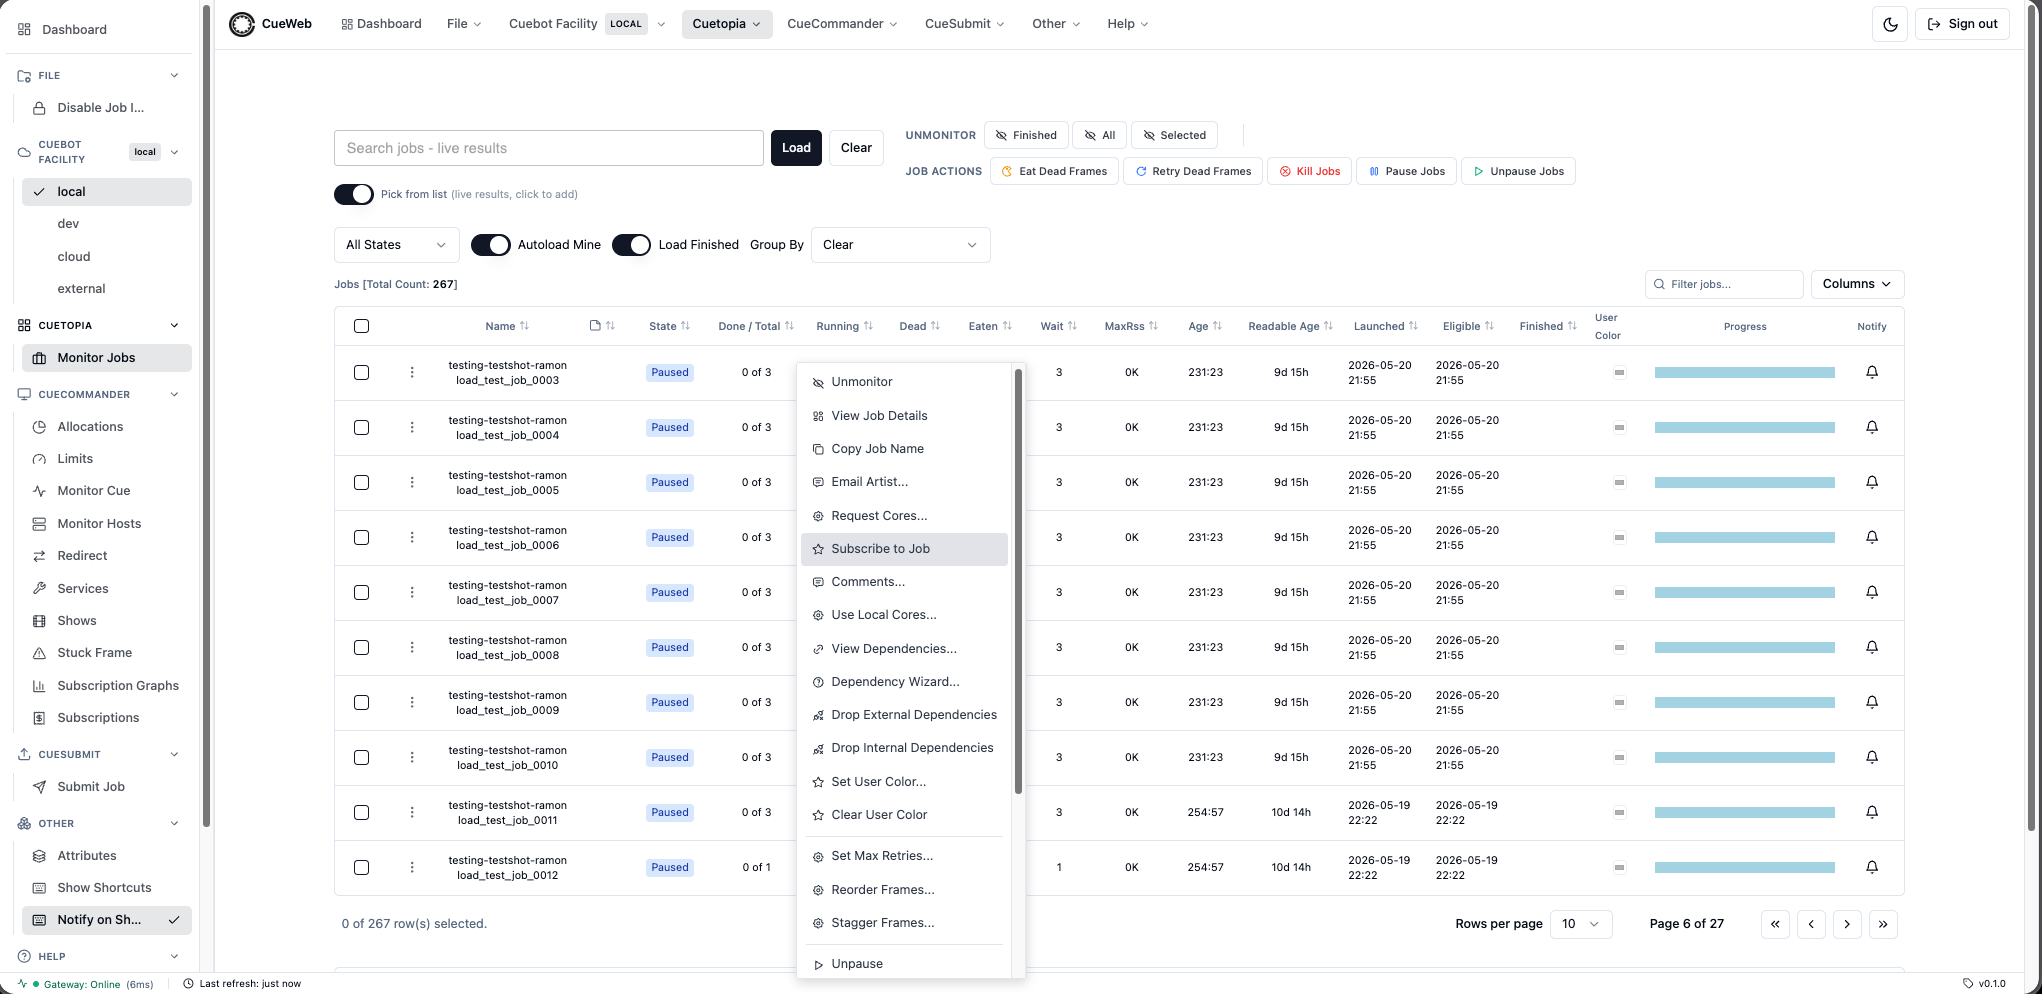
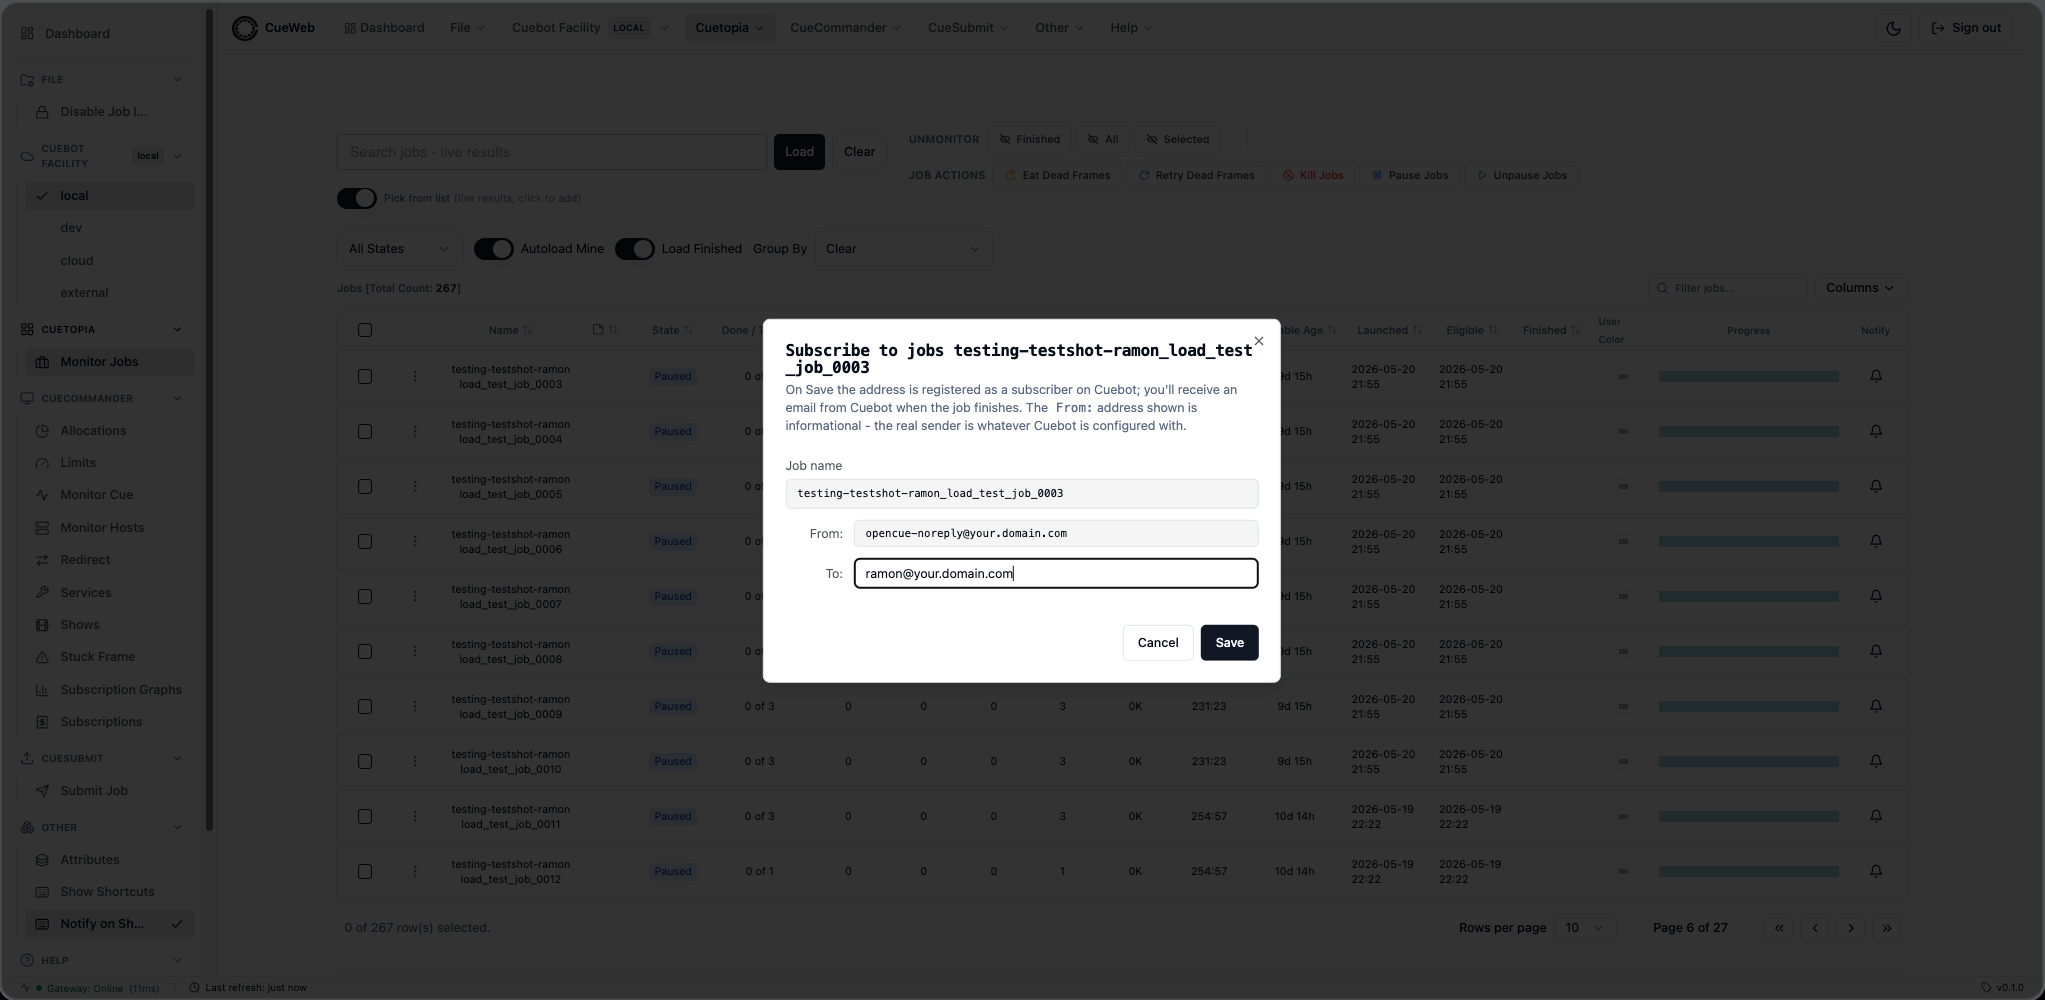
Adjust To if you want notifications sent somewhere else and click Save. A toast confirms the address has been registered with Cuebot; the email arrives from Cuebot when the job finishes.
The Notify bell and Subscribe to Job are independent - the bell lives in your browser, the email subscription lives on Cuebot. You can use either or both at the same time.
Understanding Job Status
Jobs are color-coded for quick identification:
- 🟢 Green: Jobs with running frames
- 🔵 Blue: Paused jobs
- 🟠 Orange: Pending jobs waiting for resources
- 🔴 Red: Jobs with failed frames
- ⚫ Gray: Completed jobs
Find Problem Jobs
- Click the “Failed” filter to show jobs with errors
- Look for jobs with red status indicators
- Note the frame counts in the Progress column
- Sort by “Dead Frames” to prioritize the most problematic jobs
Basic Job Management
Pausing and Resuming Jobs
Sometimes you need to pause jobs to free up resources or fix issues. The context menu shows a single Pause/Unpause entry whose label reflects the job’s current state - Pause when the job is running, Unpause when the job is already paused, and grayed out when the job is Finished.
Pause a Job
- Find the job you want to pause (anything that is not already Finished or Paused).
- Right-click the row - the entry will read Pause.
- Click Pause.
- The job status changes to “Paused” with a blue indicator, and the next time you right-click the row the same entry will read Unpause.
Resume a Job
- Find a paused job (blue indicator).
- Right-click the row - the entry will read Unpause.
- Click Unpause.
- The job returns to In Progress (or Failing / Dependency if it has dead frames or unmet dependencies).
What you’ll see in other states
- In Progress, Failing, Dependency: entry reads Pause and is active.
- Paused: entry reads Unpause and is active.
- Finished: entry reads Pause but is grayed out - a completed job cannot be paused.
Pause and Resume Practice
- Find an active job with running frames.
- Right-click and choose Pause - watch the status change to Paused.
- Wait 30 seconds for the interface to refresh.
- Right-click again - the entry now reads Unpause.
- Choose Unpause and observe how the job returns to the queue.
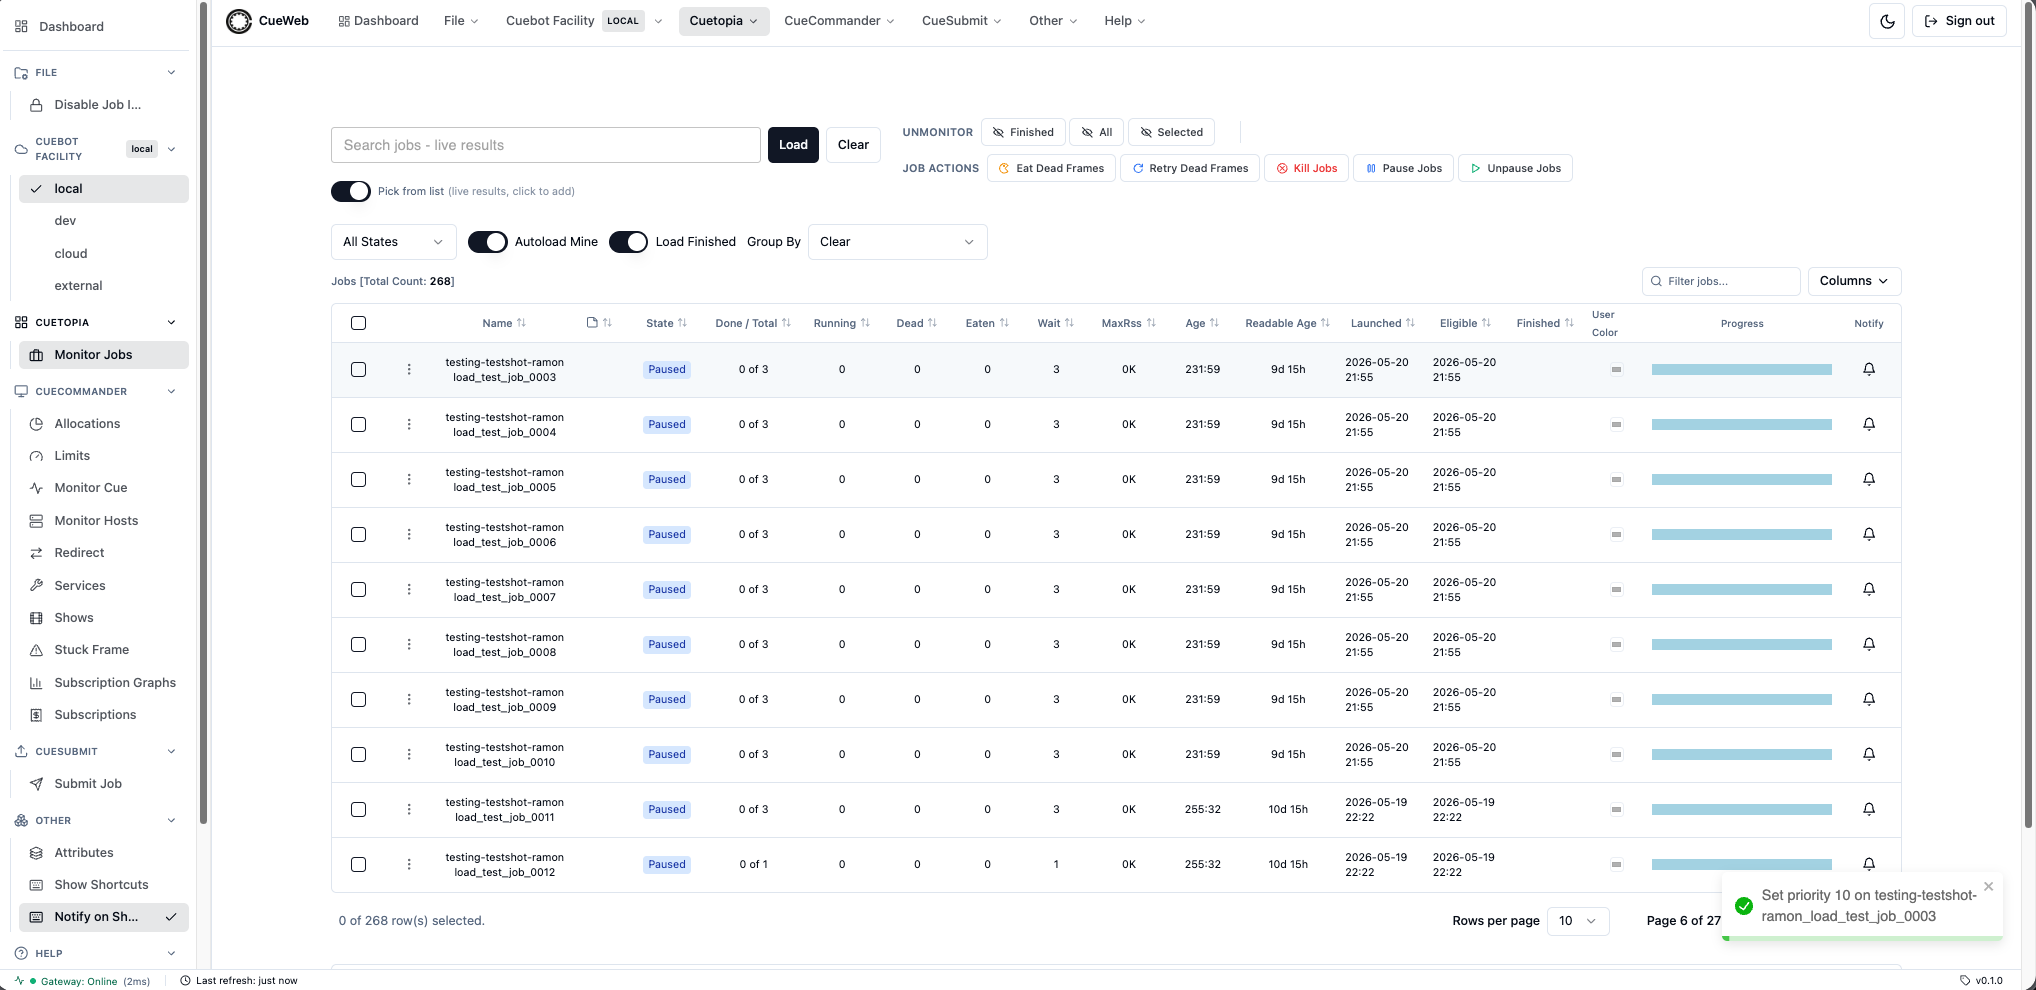
Adjusting Priority
Set Priority… is available everywhere the job context menu appears - both Cuetopia → Monitor Jobs and CueCommander → Monitor Cue. The walk-through below uses Cuetopia.
-
Right-click any job row in Monitor Jobs and pick Set Priority….
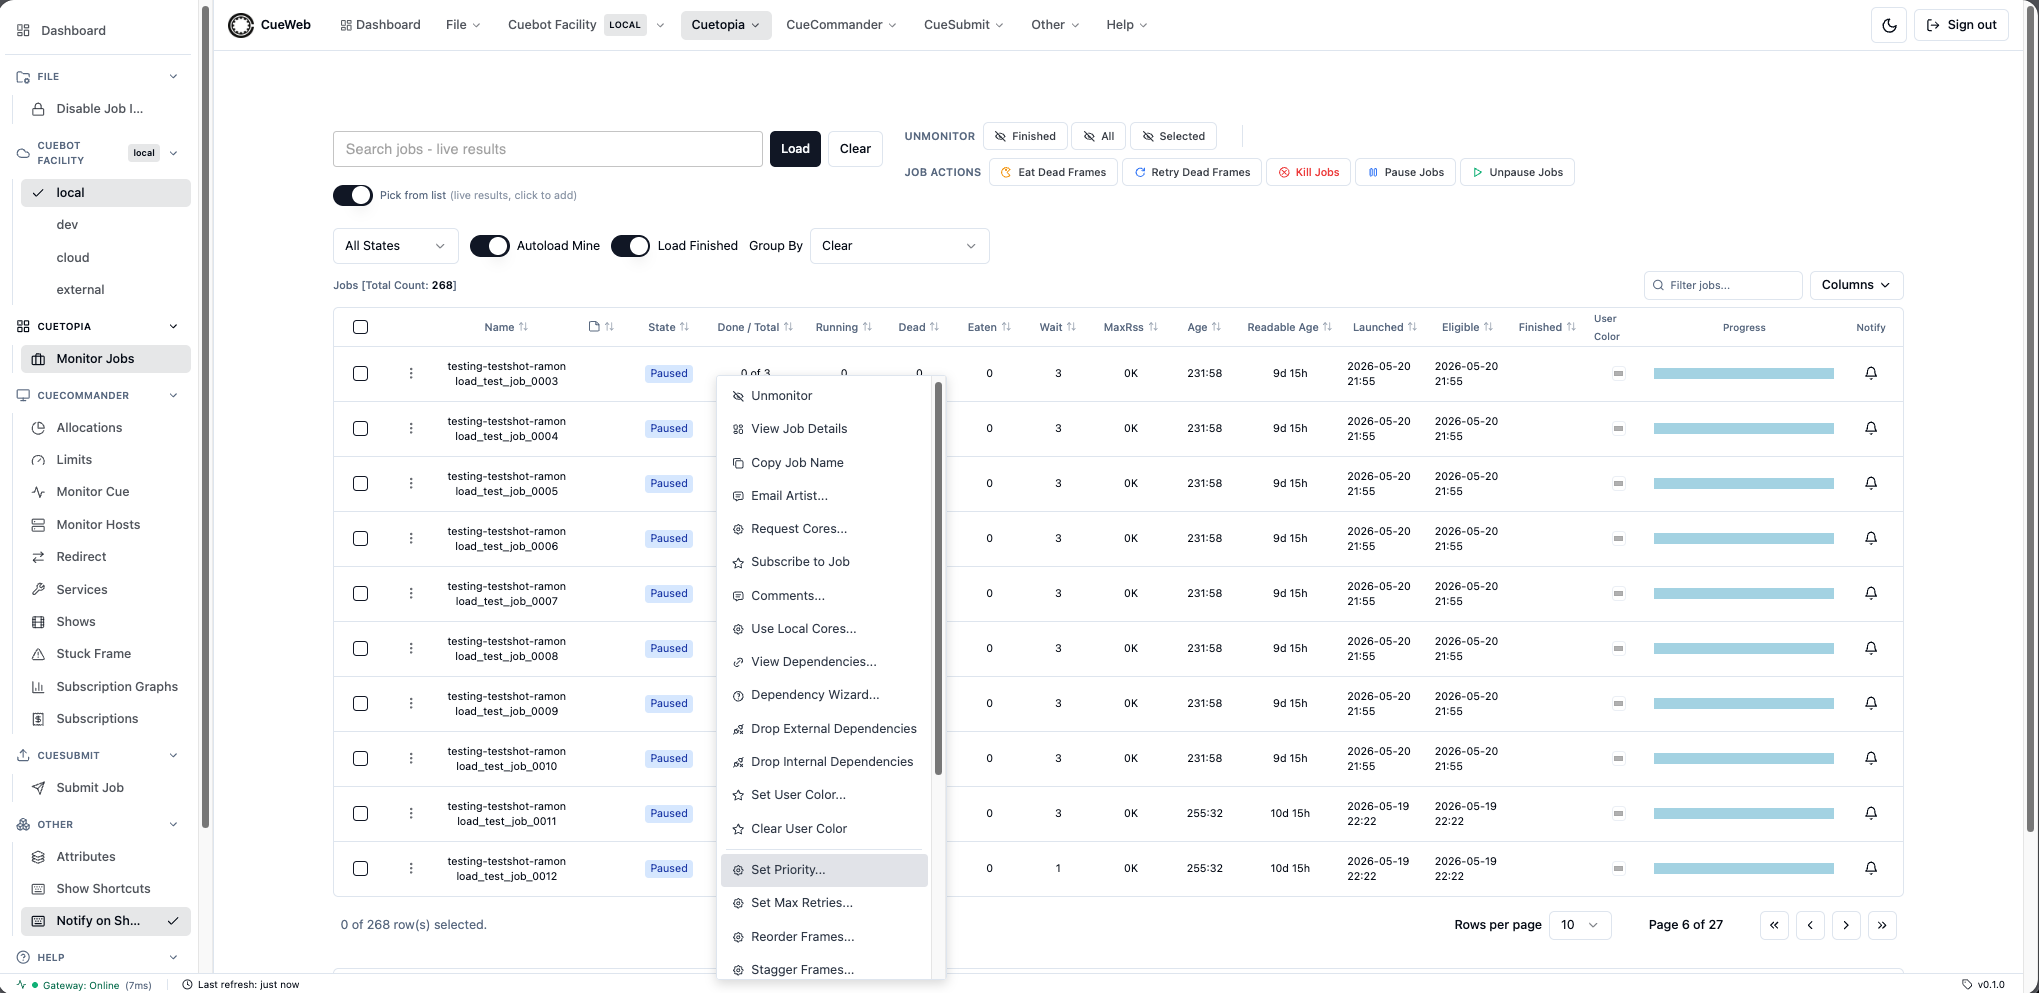
-
A themed dialog opens with a 1-100 slider and a matching number input. Either control drives the value; both stay in sync. The current priority is pre-filled (cuebot’s default is 100). Higher numbers dispatch first.
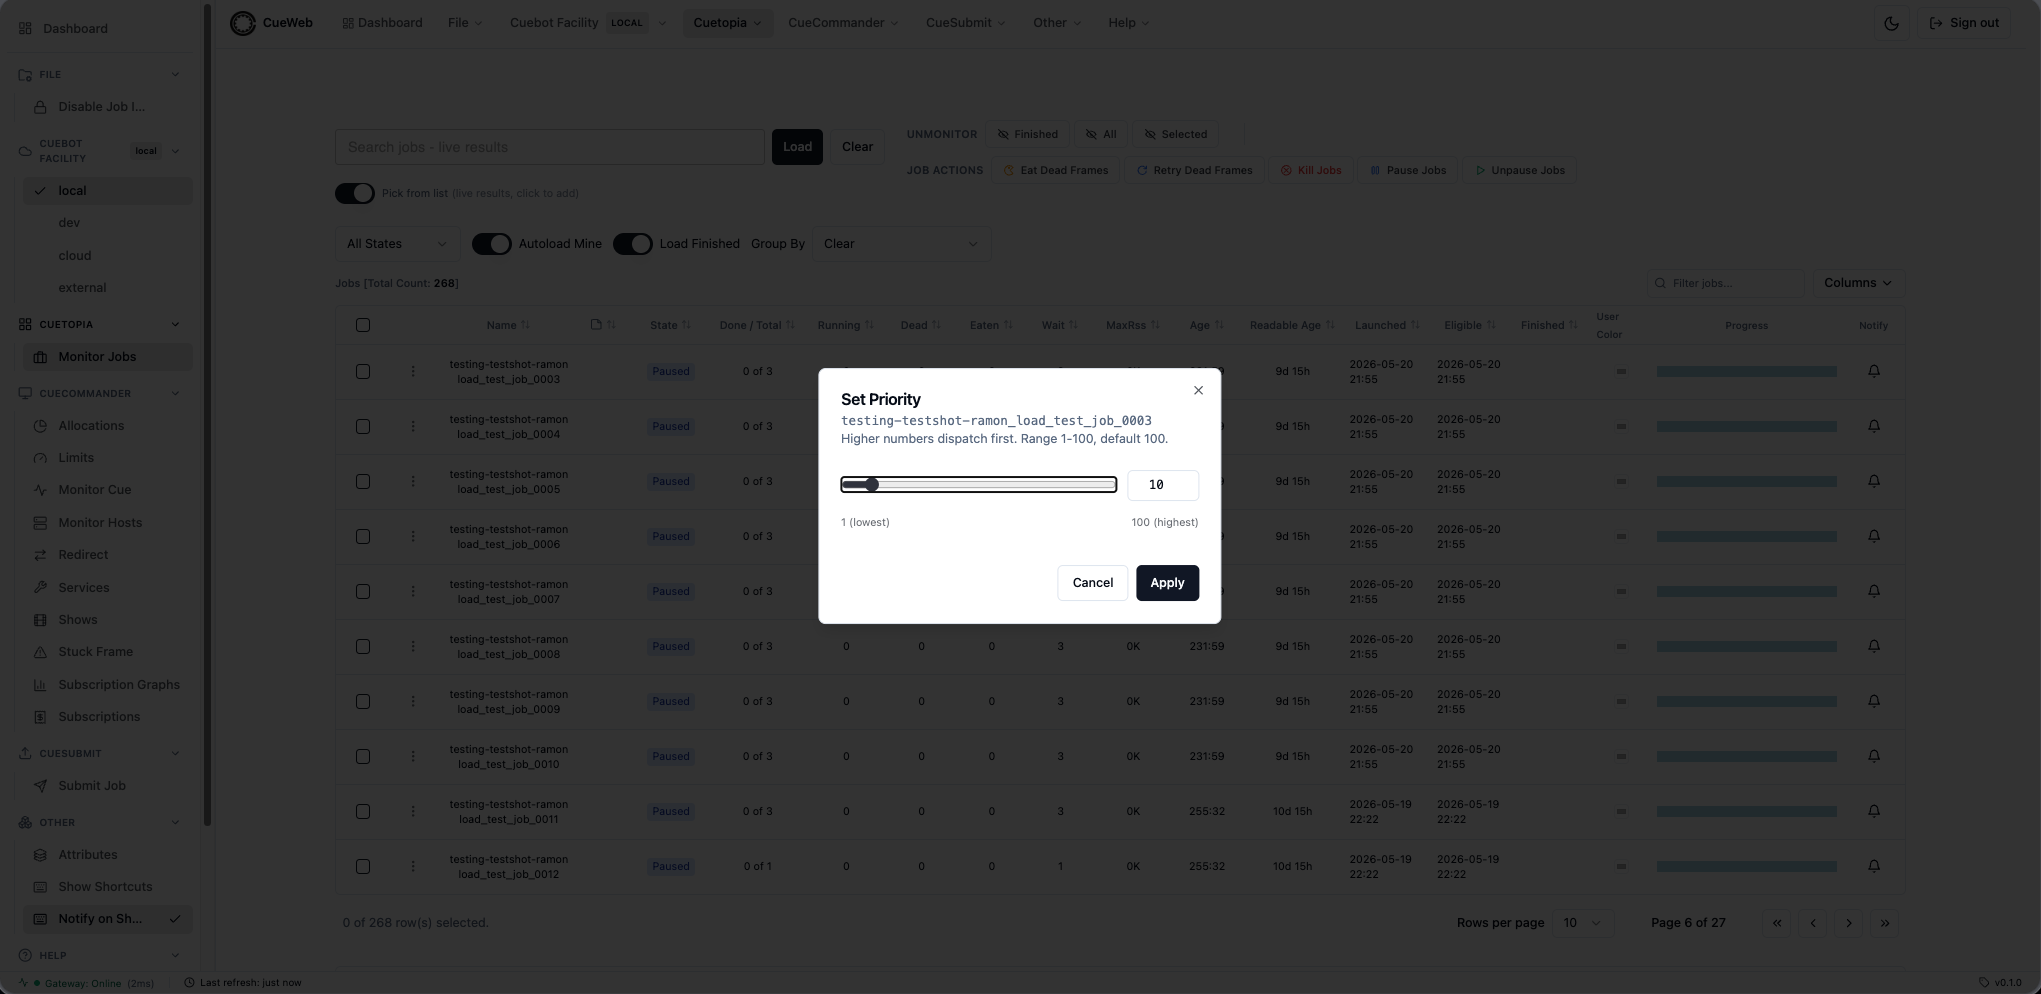
- Drag the slider to 50 (or type a value) and click Apply.
-
A toast confirms the change. The Priority column in the Jobs table updates immediately - no need to wait for the regular 5-second refresh tick.
Managing Job Dependencies
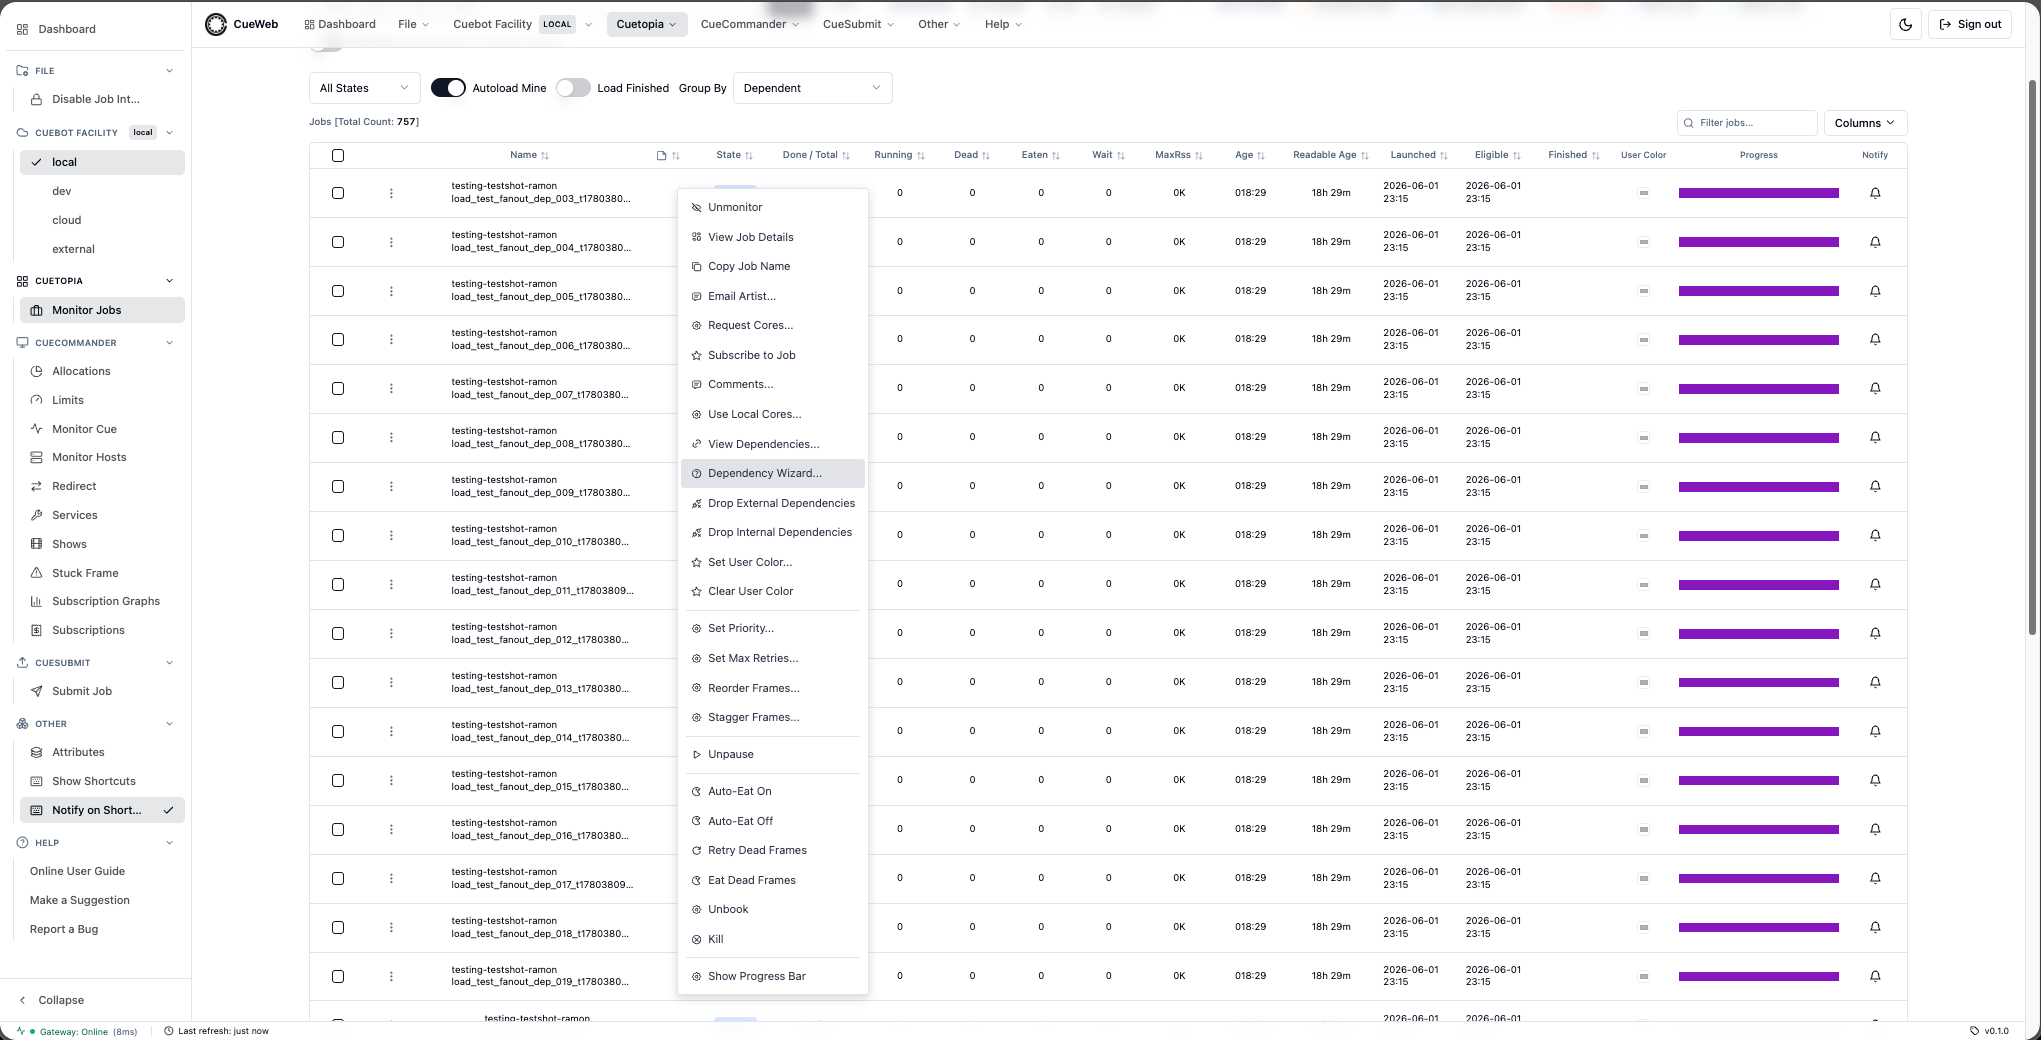
The job context menu groups four dependency actions so you can audit, create, or remove depends on a job without leaving Monitor Jobs.
-
Right-click any job row in Monitor Jobs.
-
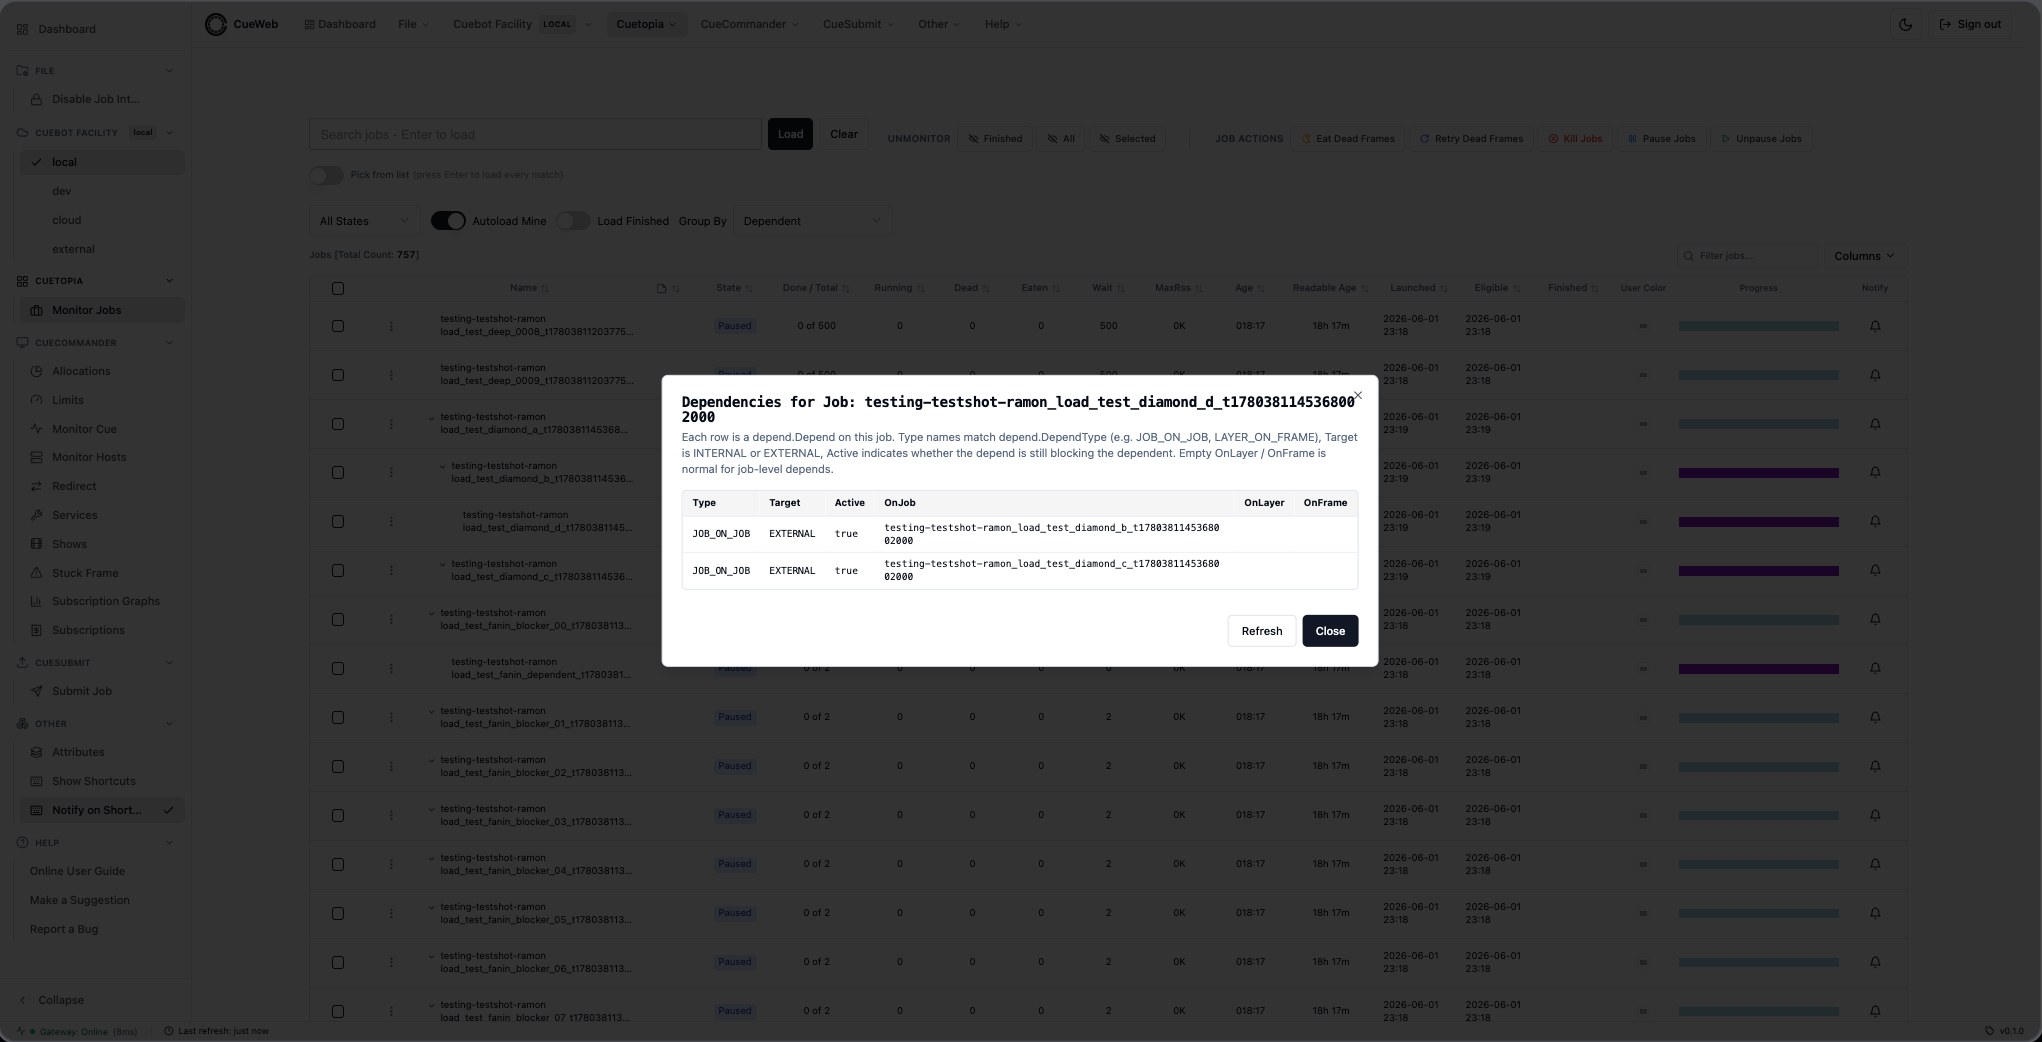
Review what’s blocking the job. Pick View Dependencies… to open a read-only dialog listing every depend on the job. Columns mirror CueGUI’s
DependDialog: Type (e.g.JOB_ON_JOB), Target (INTERNALorEXTERNAL), Active (boolean), and the OnJob / OnLayer / OnFrame identifiers. Click Refresh to re-poll the list, or Close to dismiss.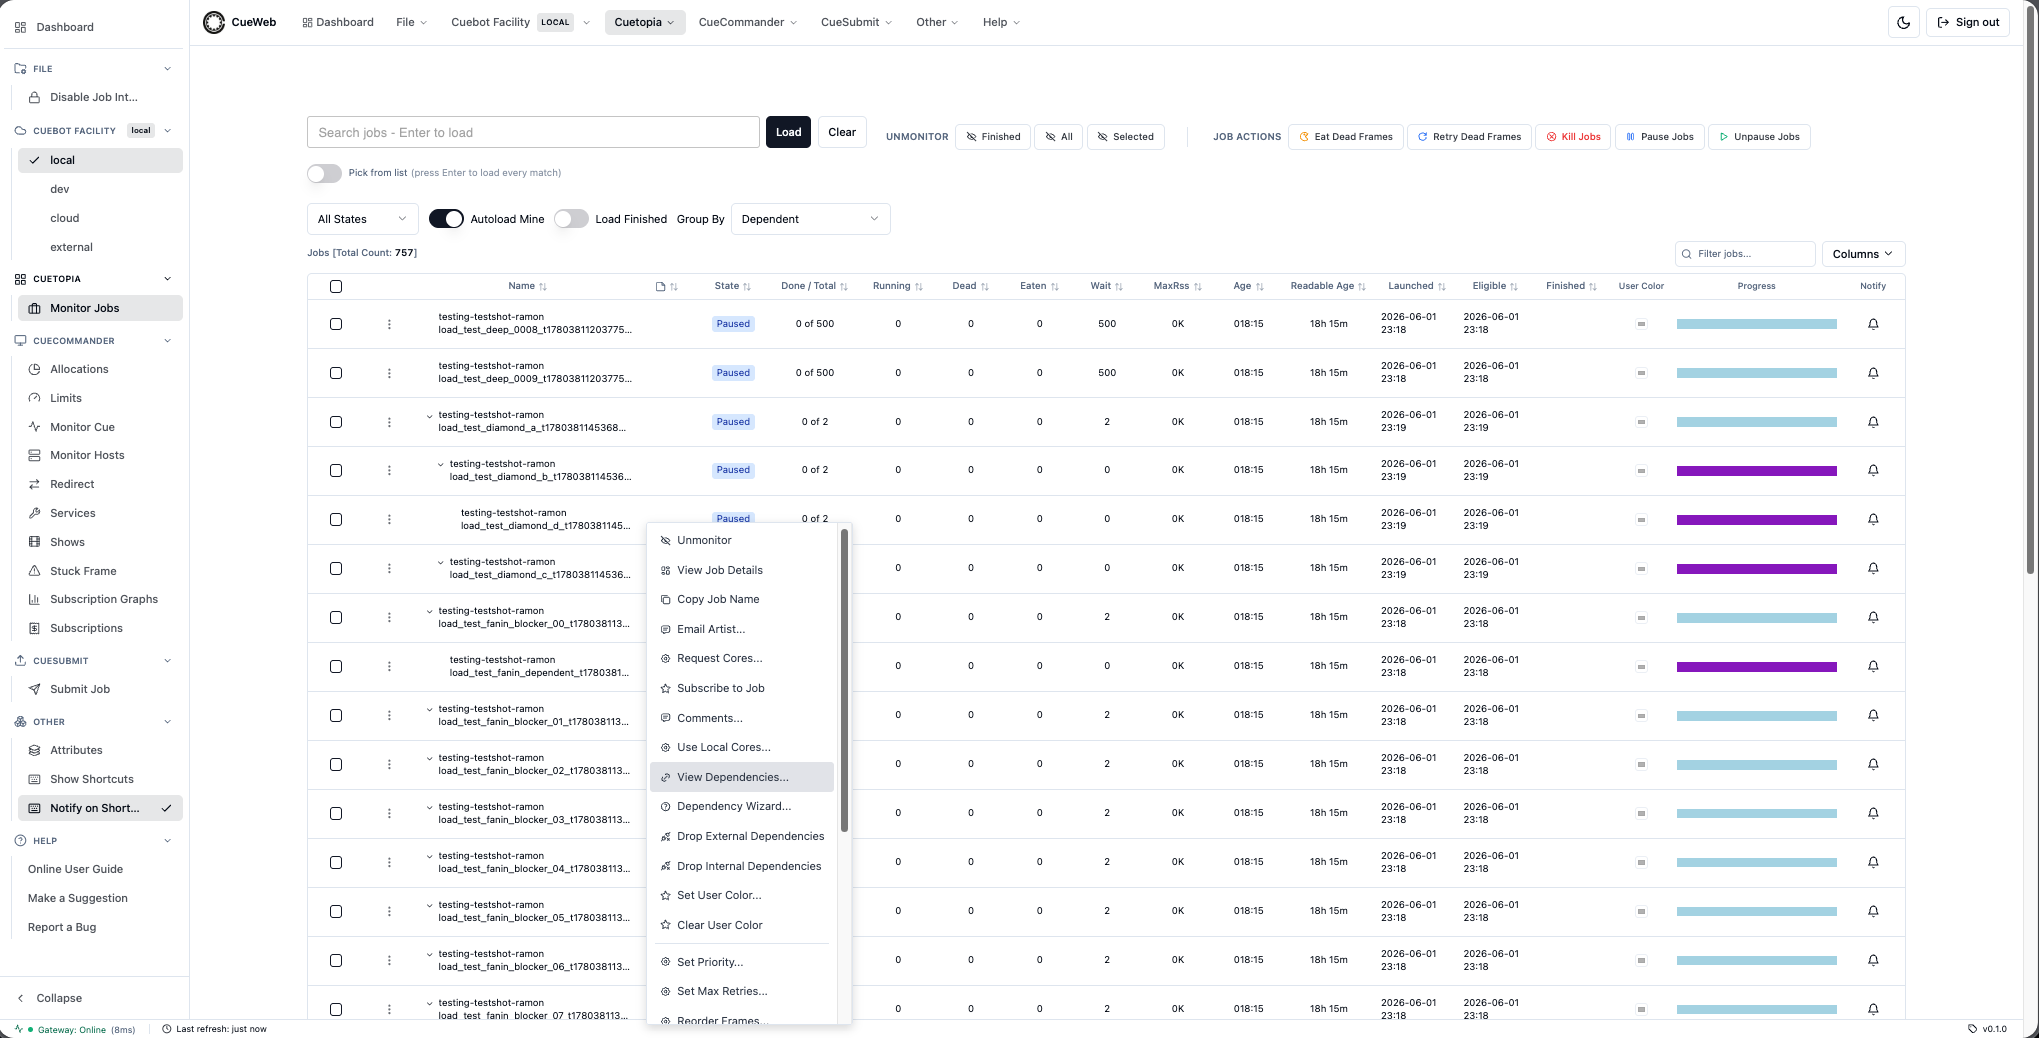
-
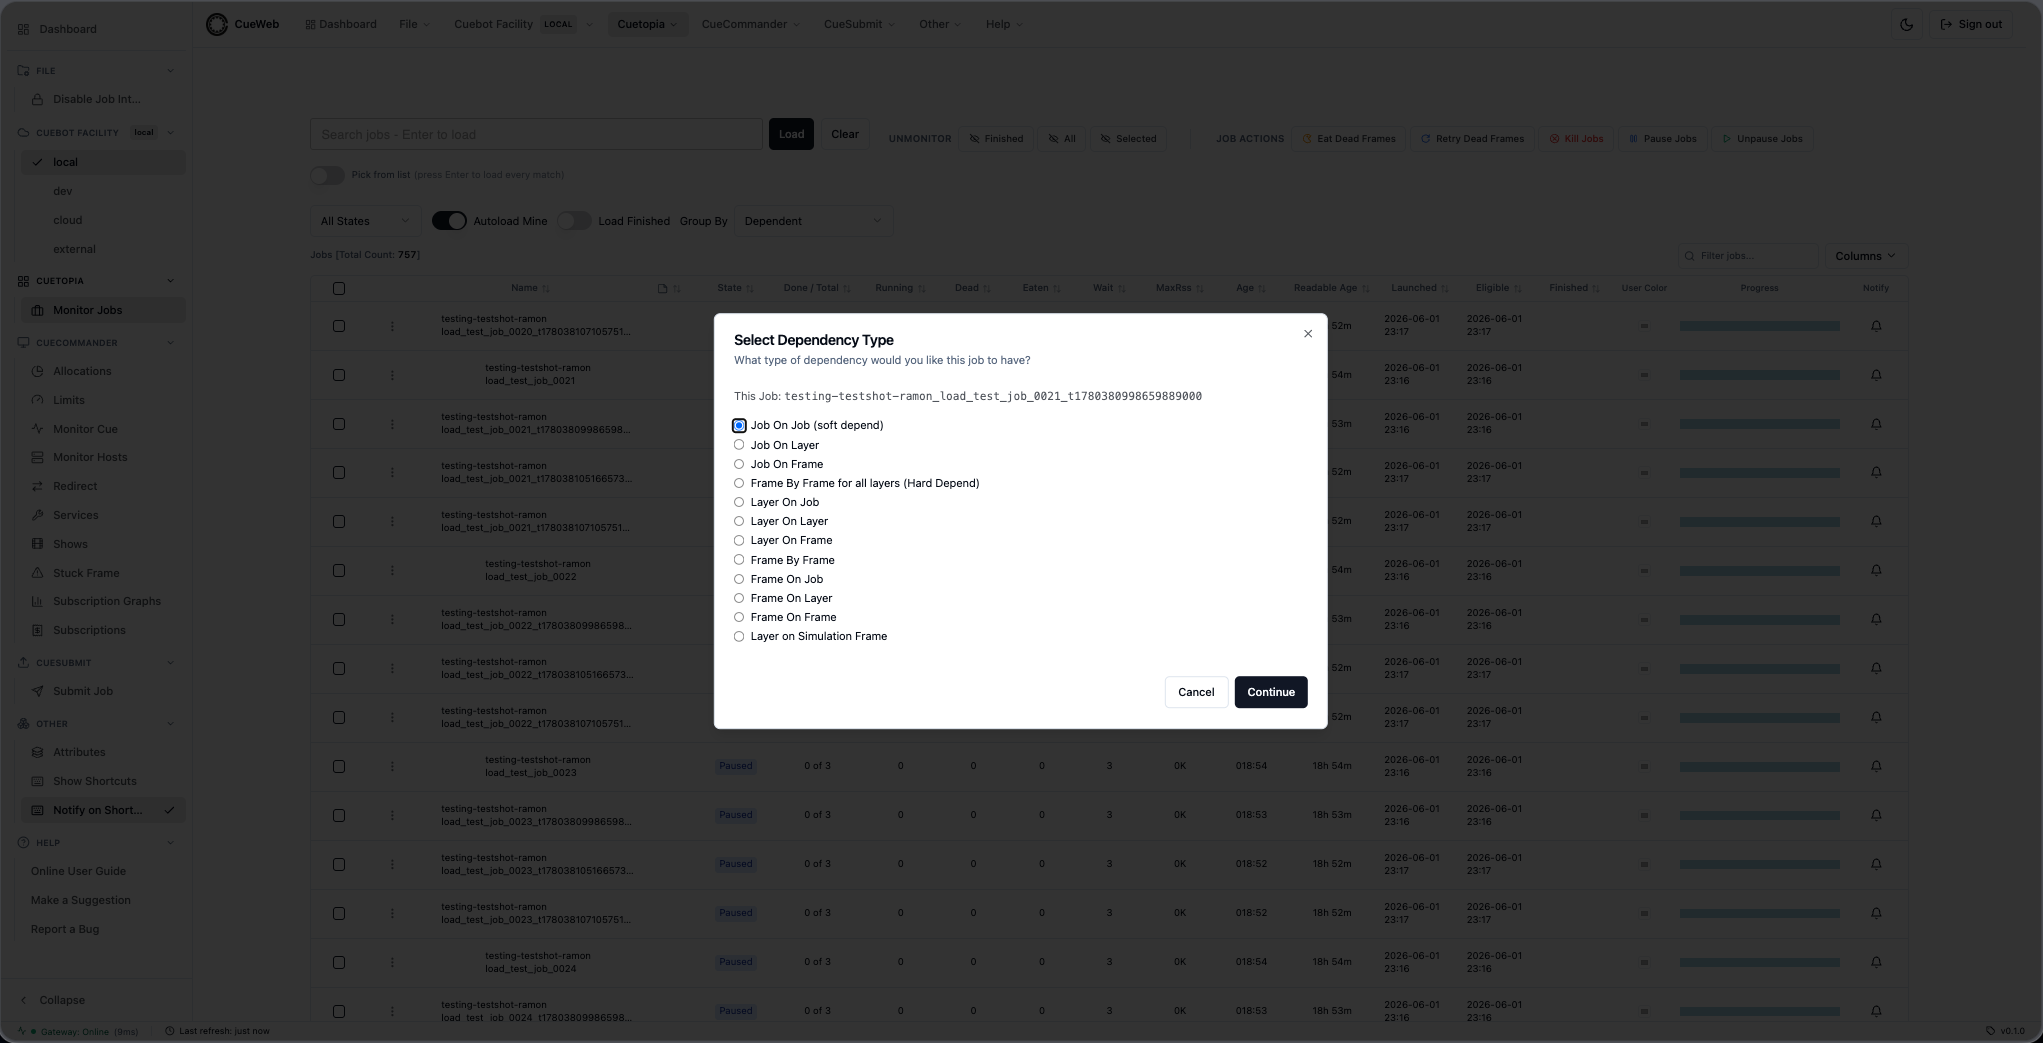
Add a new depend. Pick Dependency Wizard… to open the wizard.
The wizard implements every CueGUI
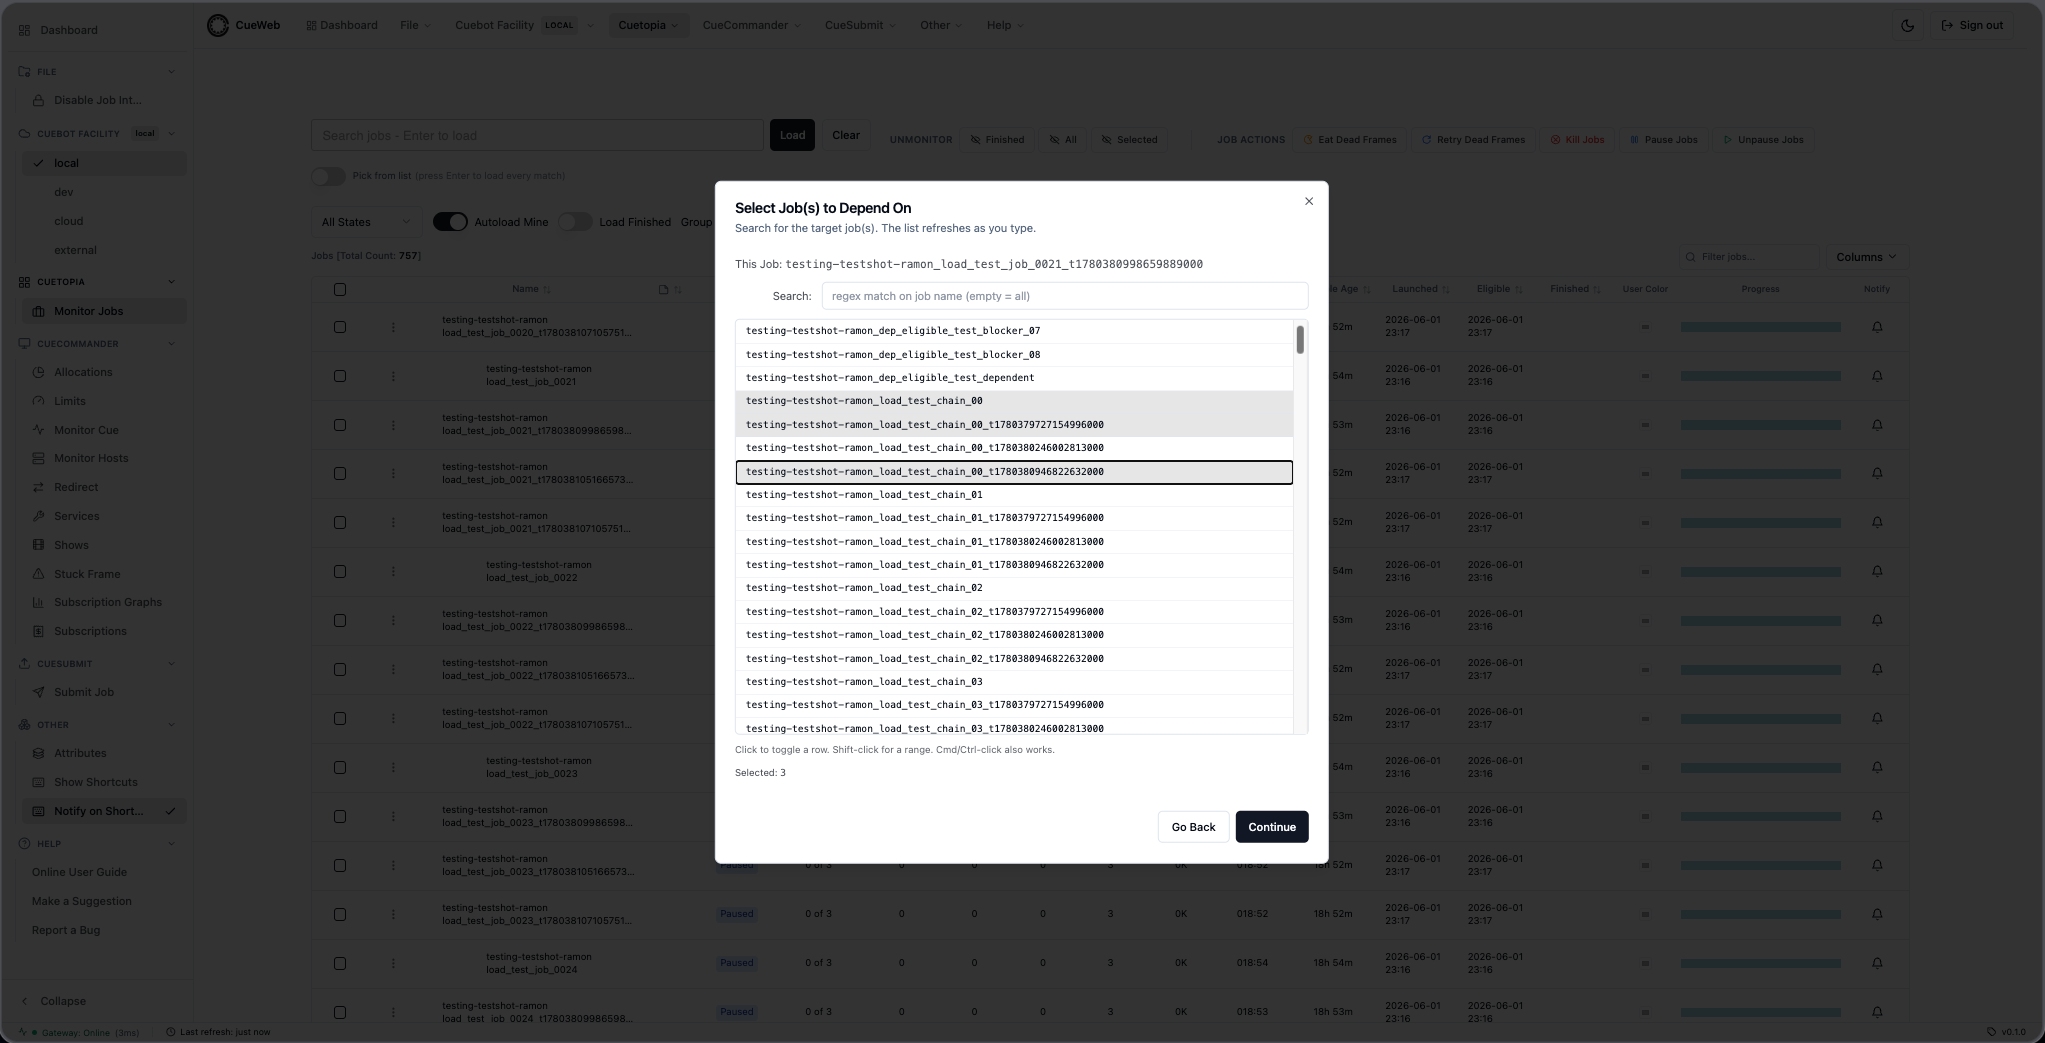
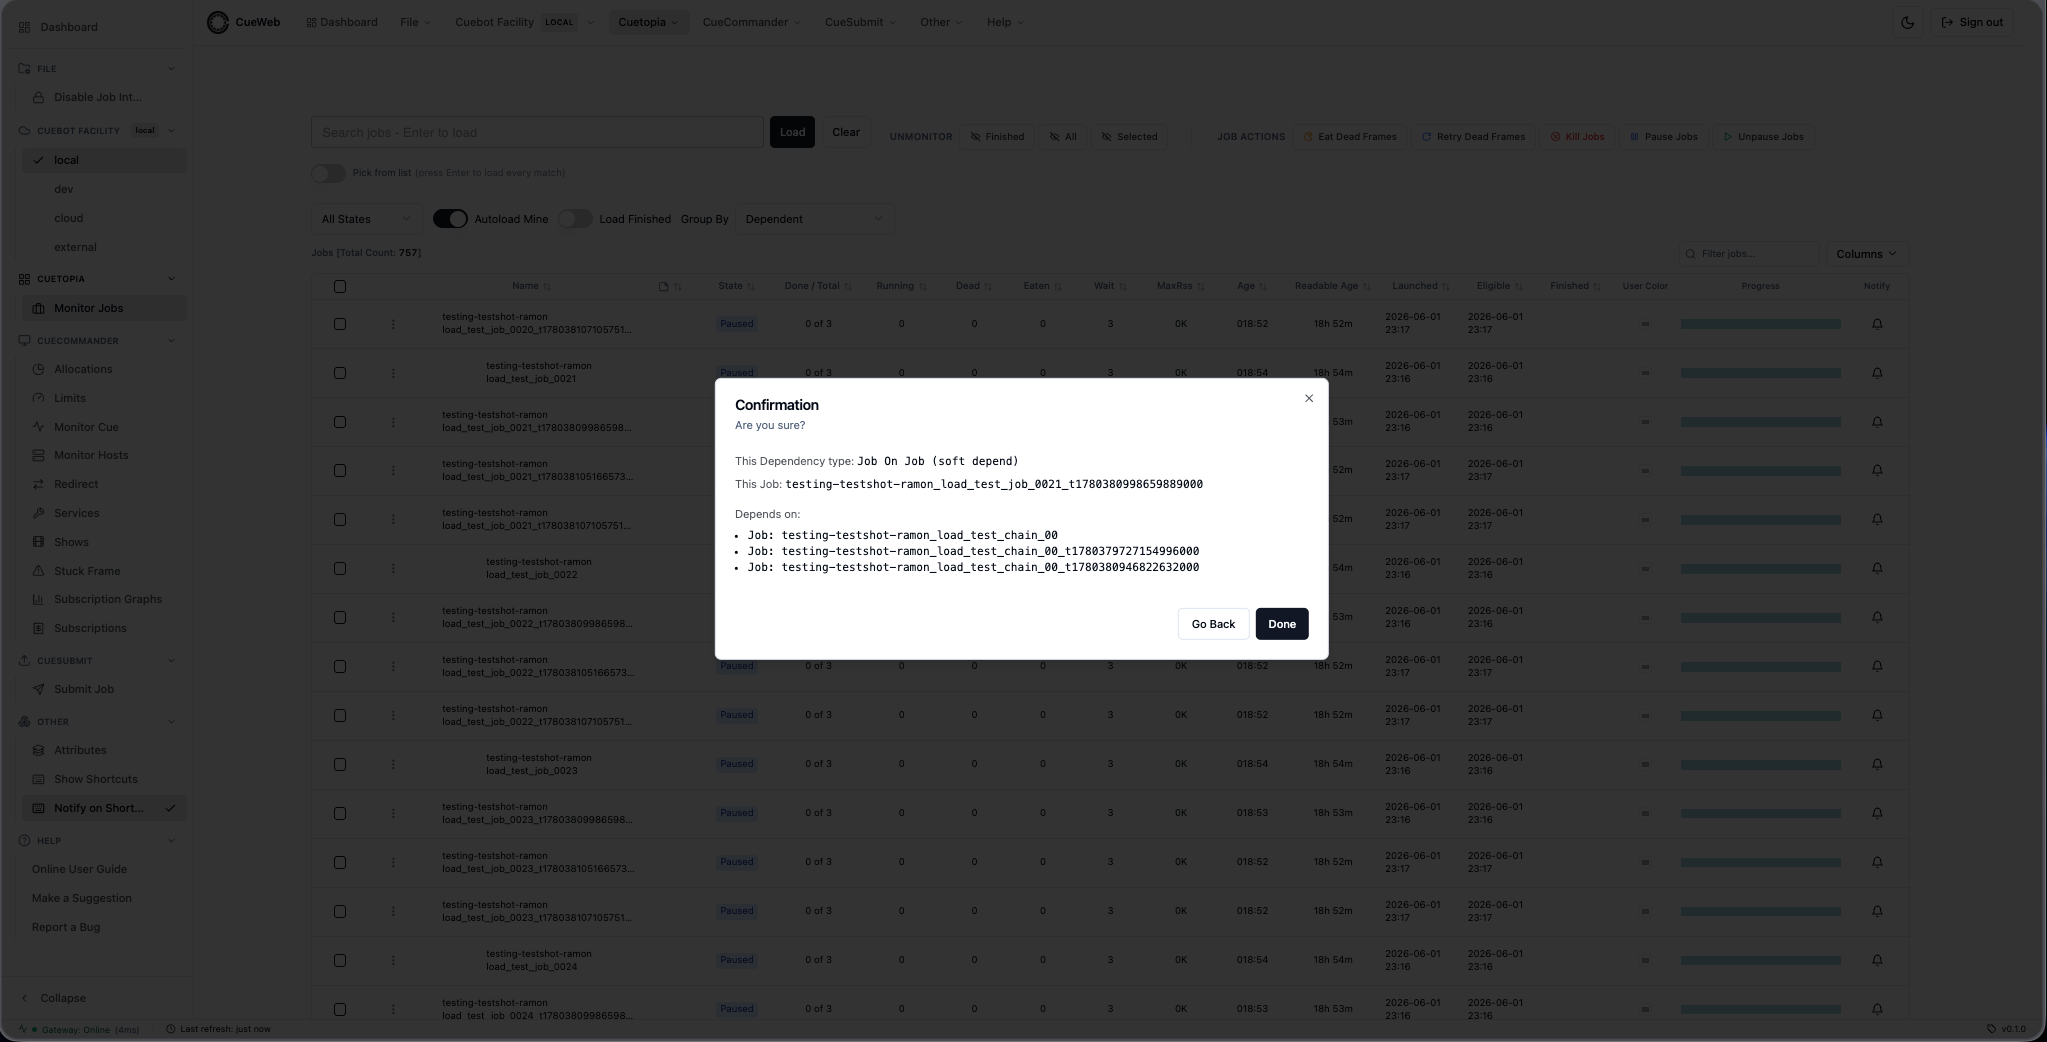
depend.DependType(Job On Job, Job On Layer, Job On Frame, Frame By Frame for all layers / Hard Depend, Layer On Job / Layer / Frame, Frame By Frame, Frame On Job / Layer / Frame, and Layer on Simulation Frame). Step count scales with the chosen type - the simplest (Job On Job) is three steps, the longest (Frame On Frame) is seven. Every picker is multi-select; Done fires the full source x target cross-product in one batch.The simplest path - Job On Job - has three steps:
-
Step 1: pick the dependency type.
-
Step 2: pick the target job(s) the current job should depend on.
-
Step 3: confirm the summary and click Done. A success toast confirms the depend was created.
Per-type walk-throughs for every other depend type (with screenshots of every step) live in the Dependency Wizard dialog reference.
-
-
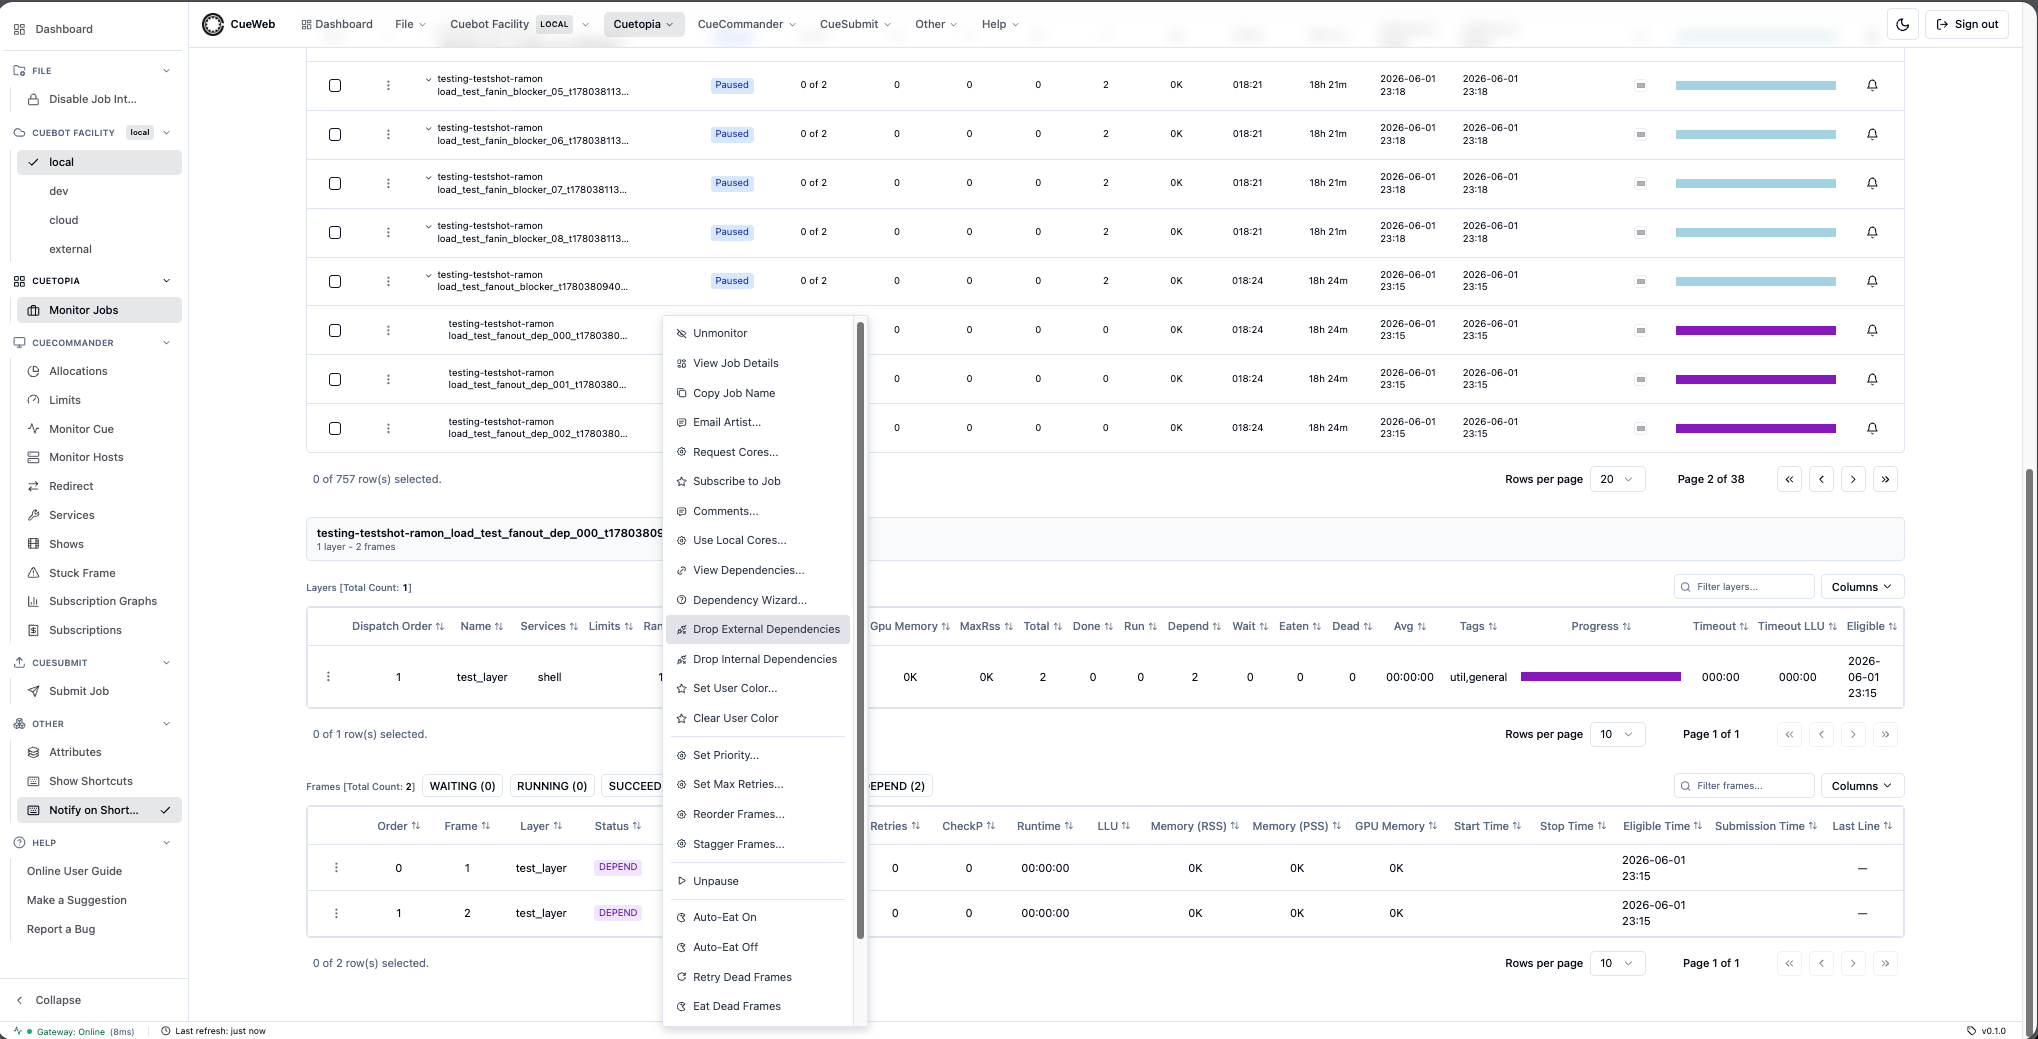
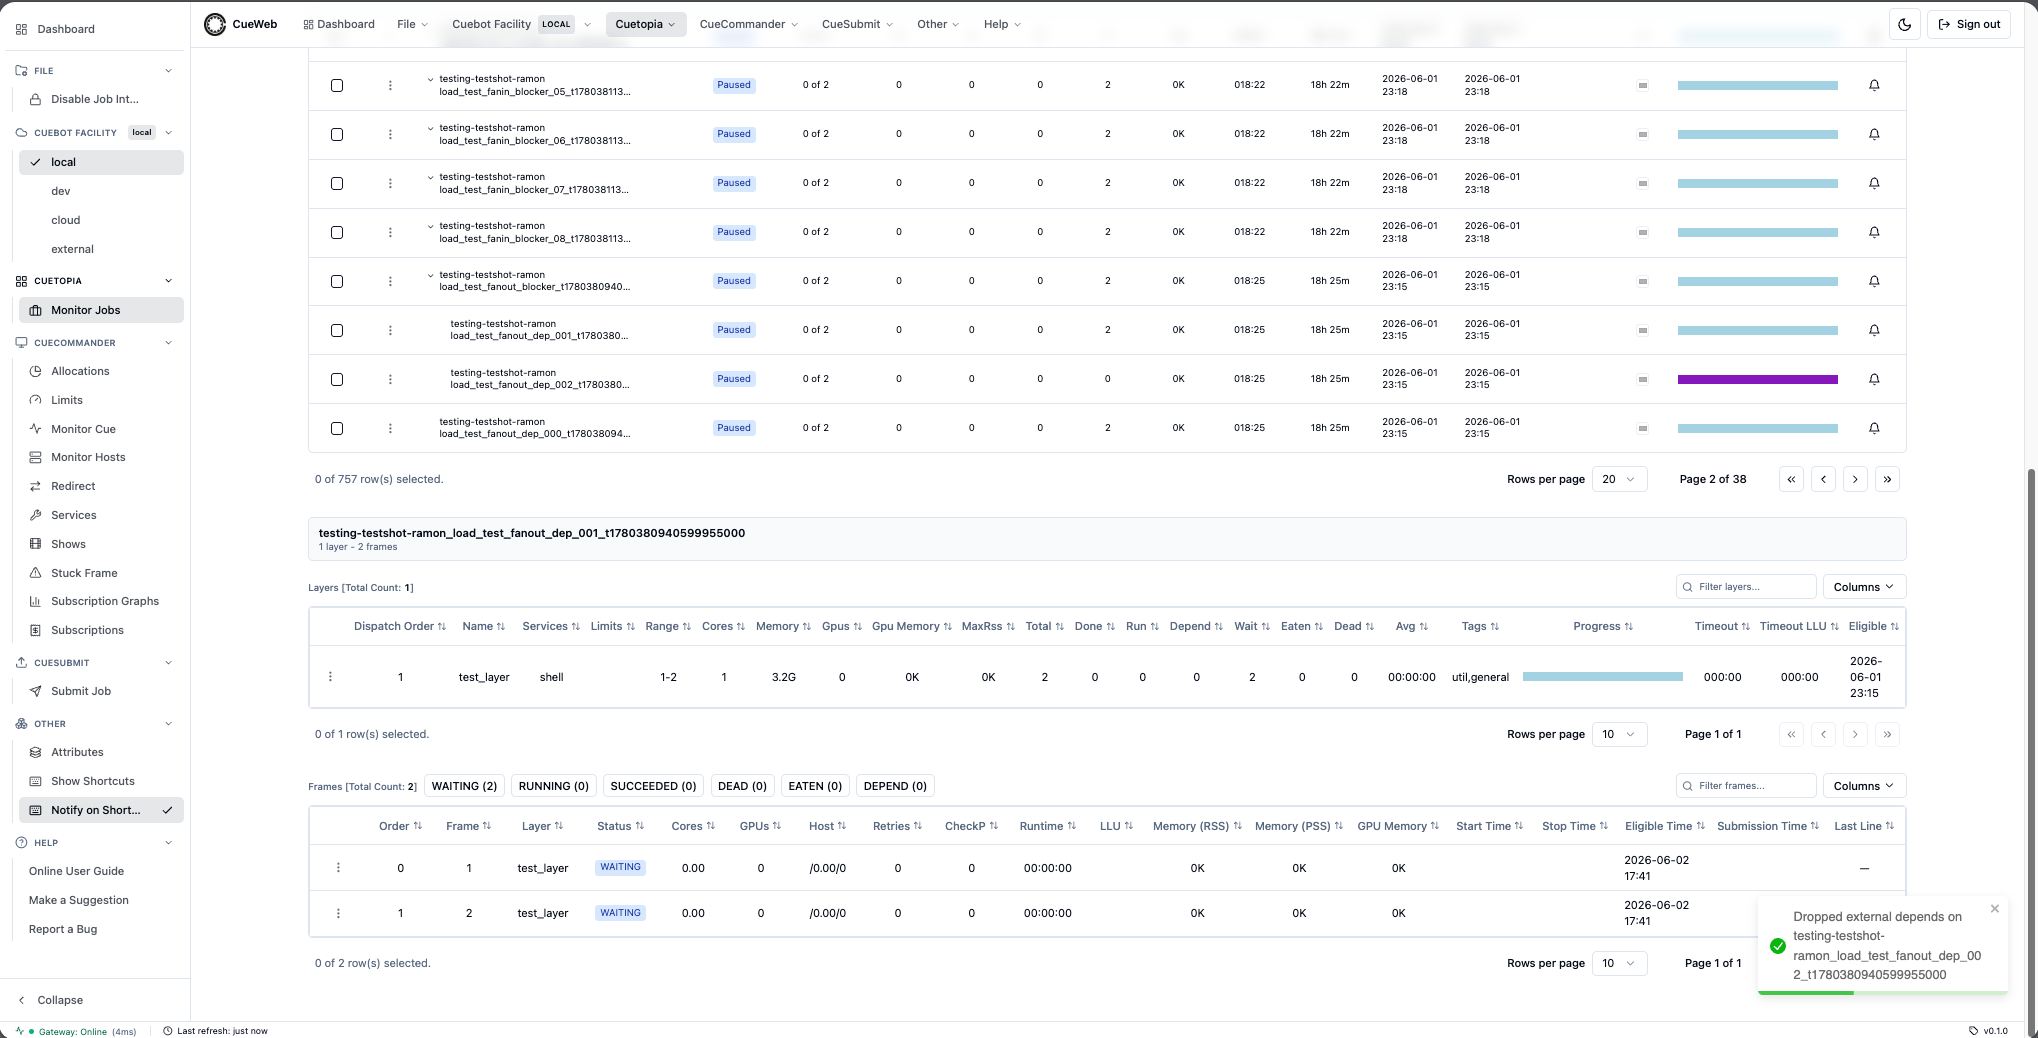
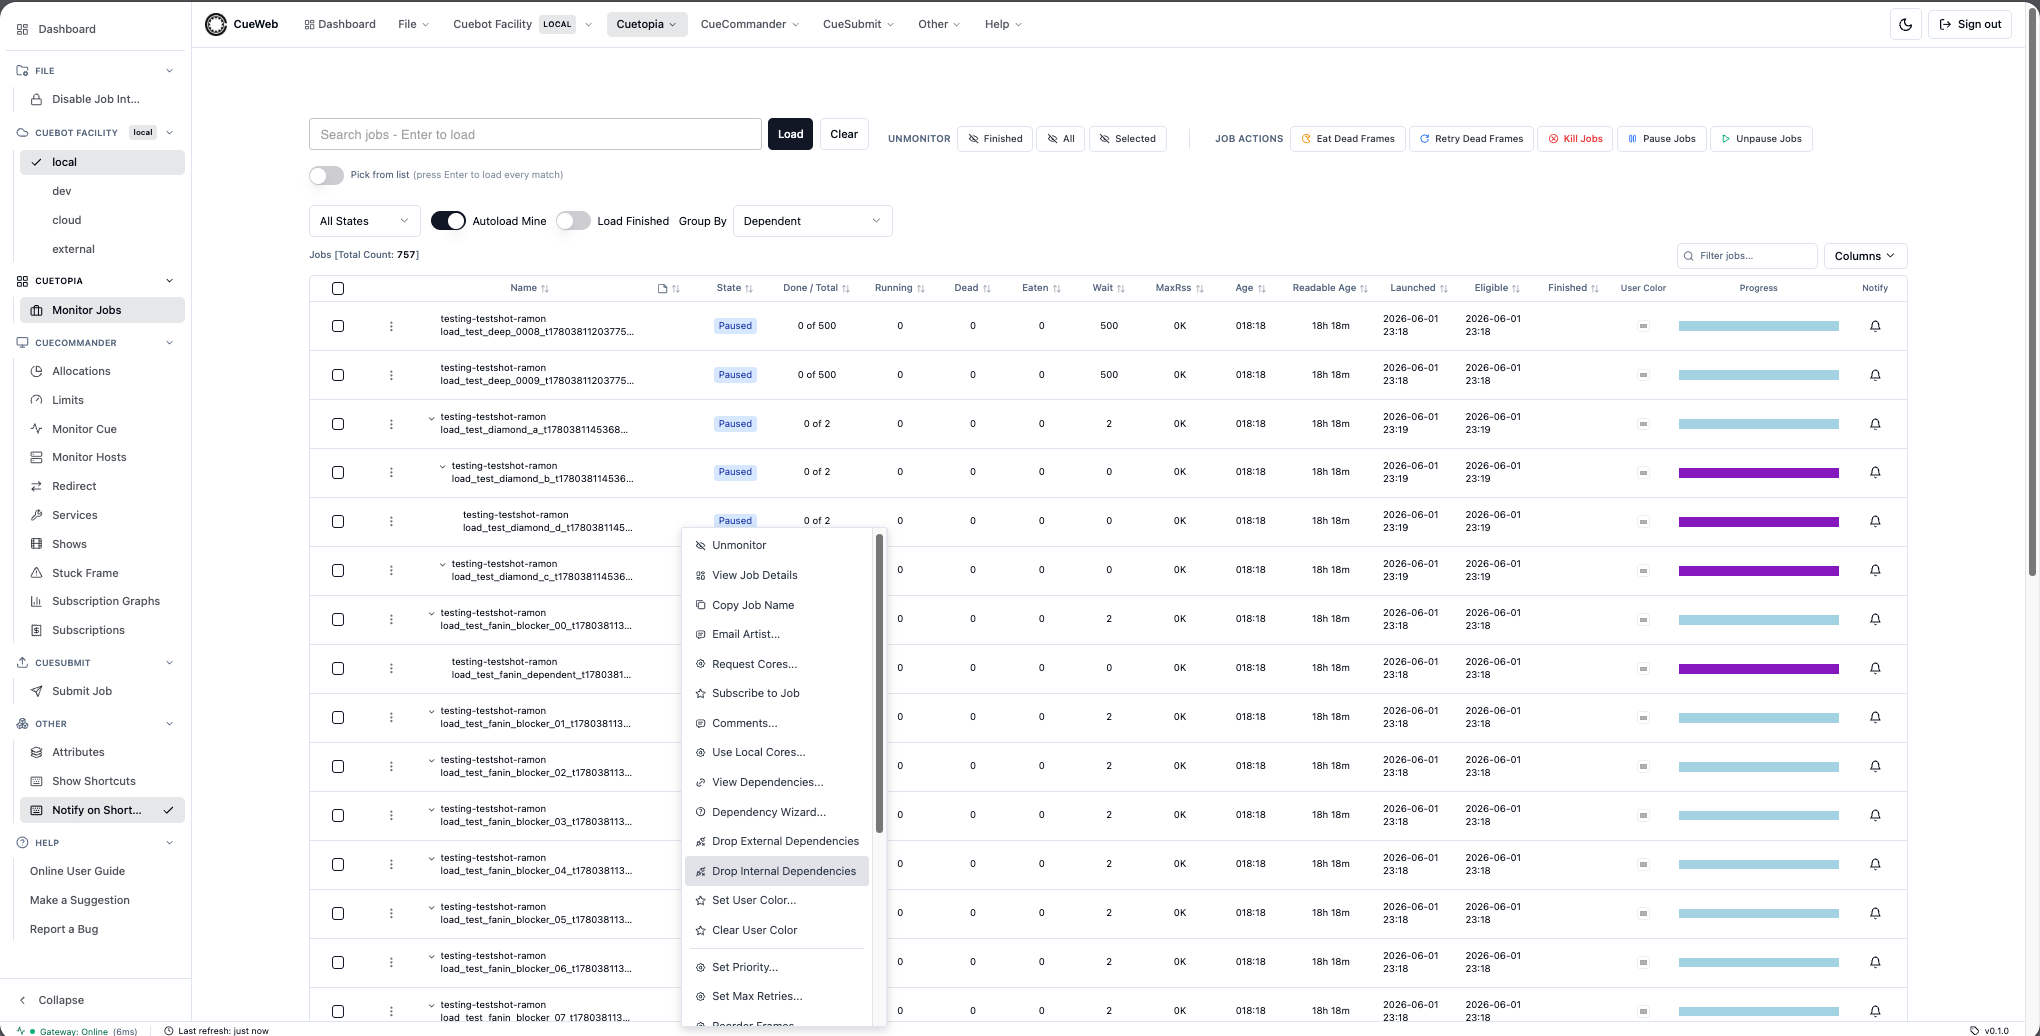
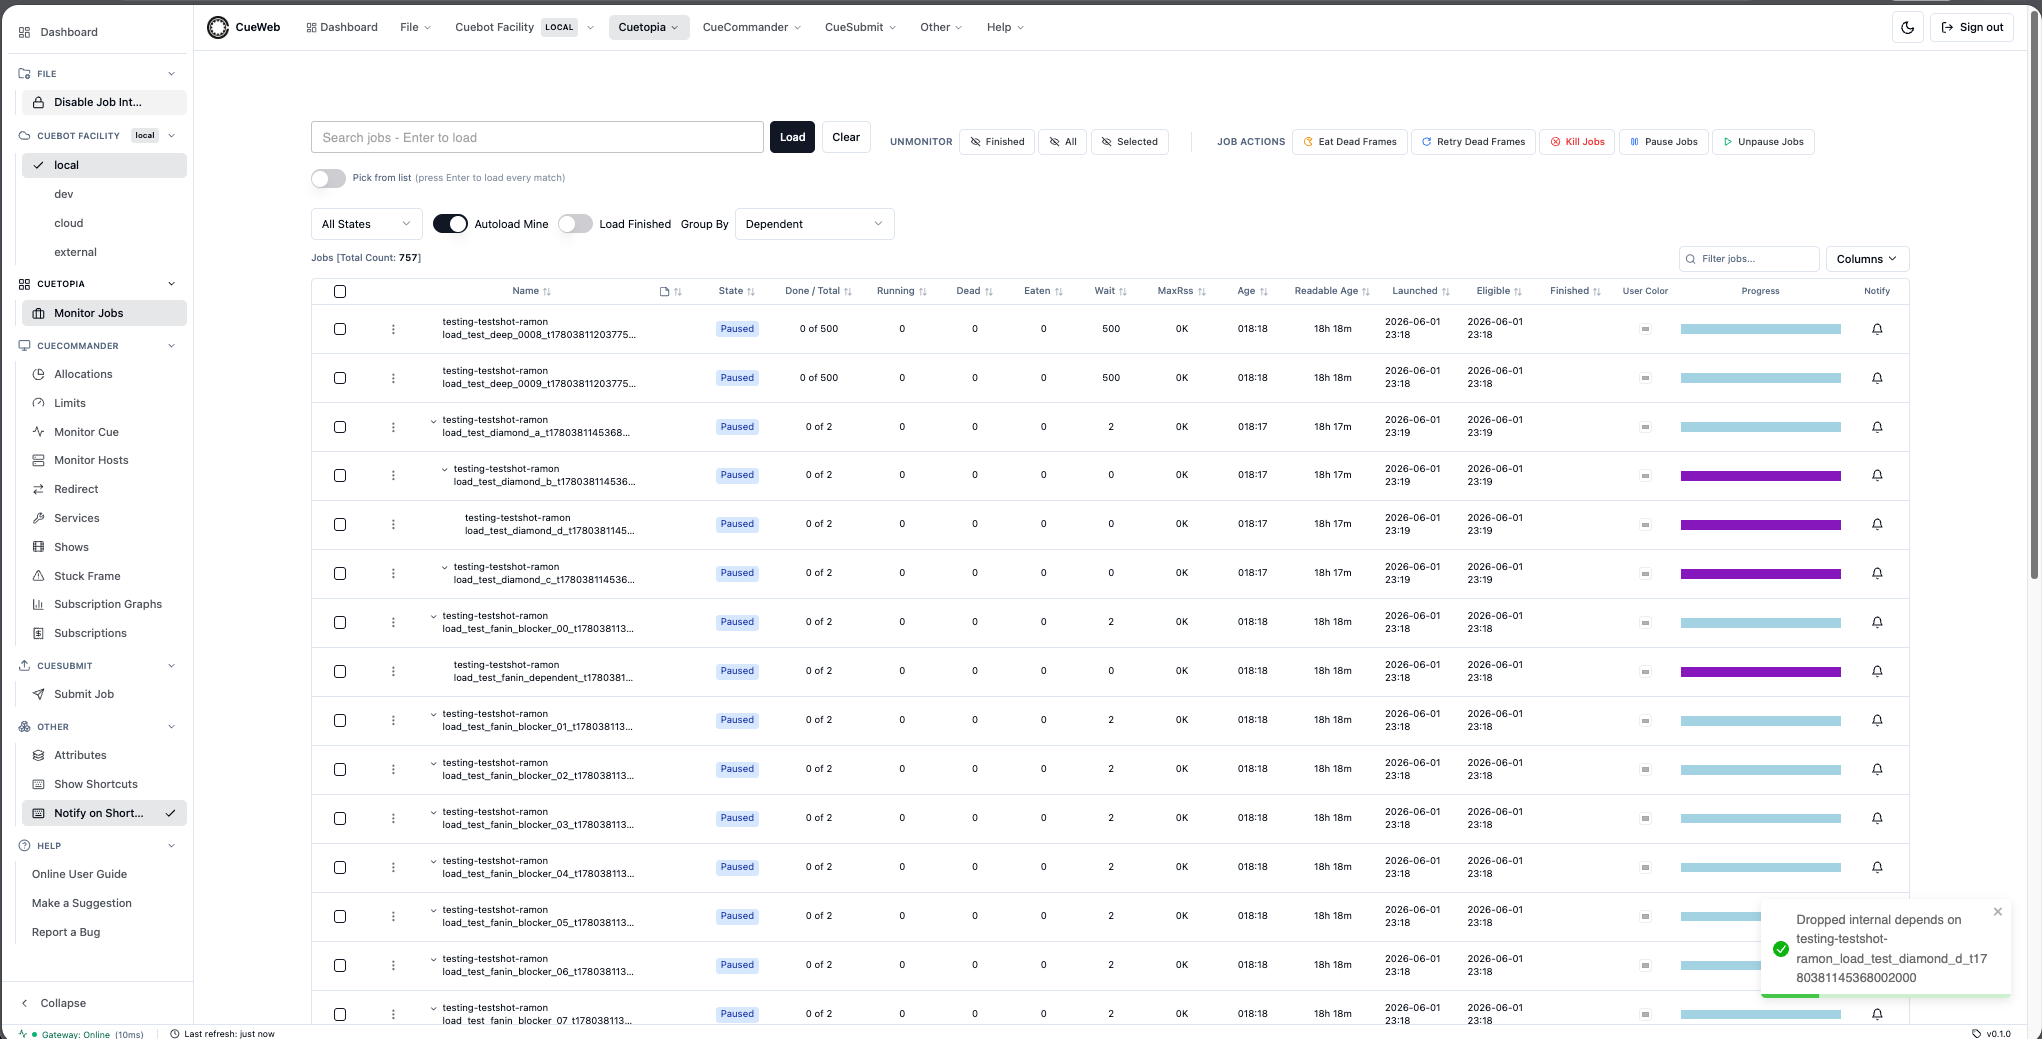
Remove depends in one click. Pick Drop External Dependencies to remove every cross-job depend, or Drop Internal Dependencies to remove every within-job depend. Both surface a success toast and trigger an immediate re-poll of the Jobs table plus a refresh of the Group-By Dependent tree, so the chevrons and DEPENDENCY-state rows update without waiting for the autoload tick.
Visualizing the dependency graph
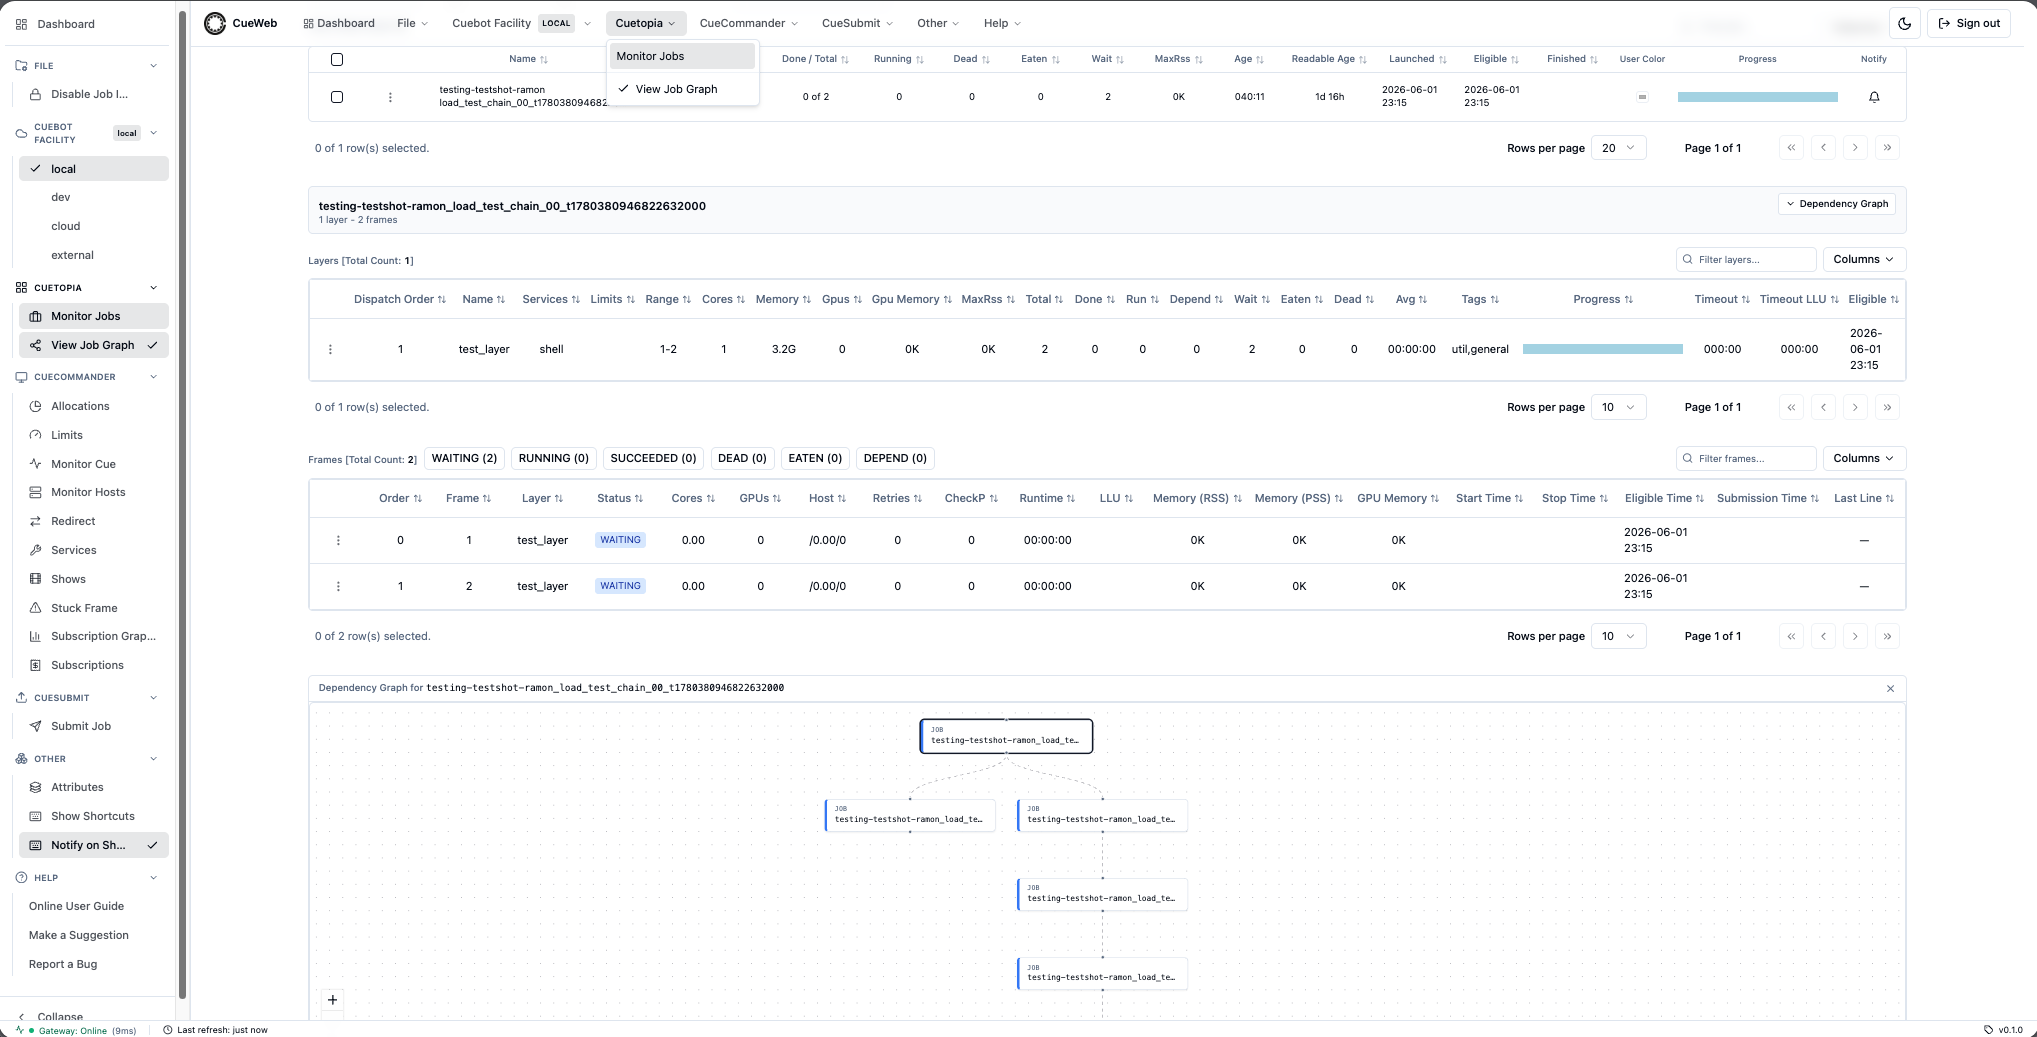
When you want to see a render chain rather than read a table of depends, turn on the Job Dependency Graph - a read-only node graph mirroring CueGUI’s Monitor-Jobs dependency-graph dock.
-
Enable the graph. Open the Cuetopia menu (header dropdown or sidebar) and click View Job Graph. The entry is a checkable toggle - a check mark appears when it is on, and the choice is remembered across pages, tabs, and reloads.
-
Open a job. Click a job row in Monitor Jobs. The graph mounts as a third panel under the inline Layers and Frames panels. It walks the job’s depends in both directions - what the job depends on and what depends on the job - and lays the result out top-to-bottom.
-
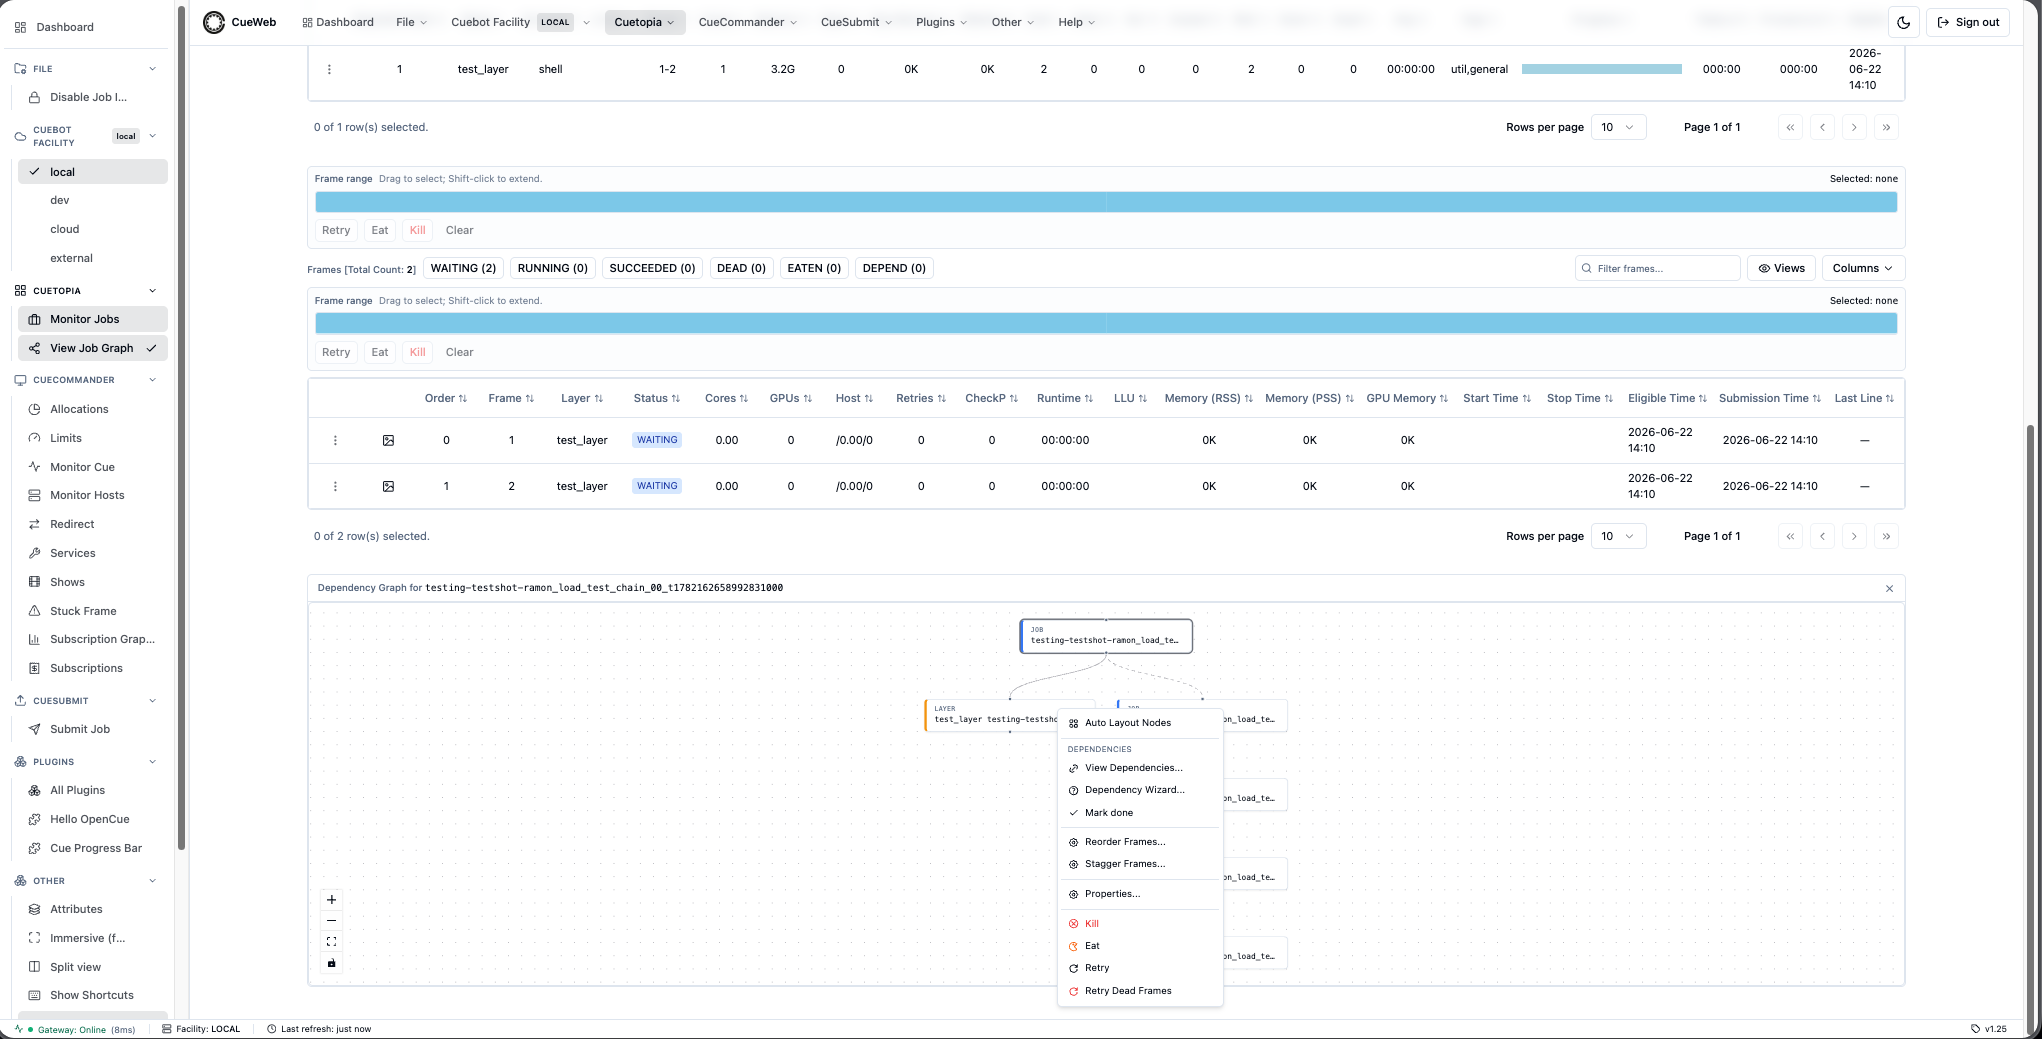
Read the graph. The focus job is shown with its layers, so even a job with no cross-job dependencies still renders its structure. Each node carries a kind label (JOB / LAYER / FRAME) and a color-coded left border; the job you opened the panel for is ringed. Hover a node to see its full name. Use the corner controls to pan, zoom, and fit. Collapse or close the panel from the Dependency Graph button above Layers or the panel’s × button.
-
Navigate and act. Double-click a node to open that job’s detail page (a single click only selects it). Right-click a layer node for the same actions as the Layers table - Auto Layout Nodes; Dependencies (View Dependencies… / Dependency Wizard… / Mark done); Reorder Frames…; Stagger Frames…; Properties…; Kill / Eat / Retry / Retry Dead Frames.
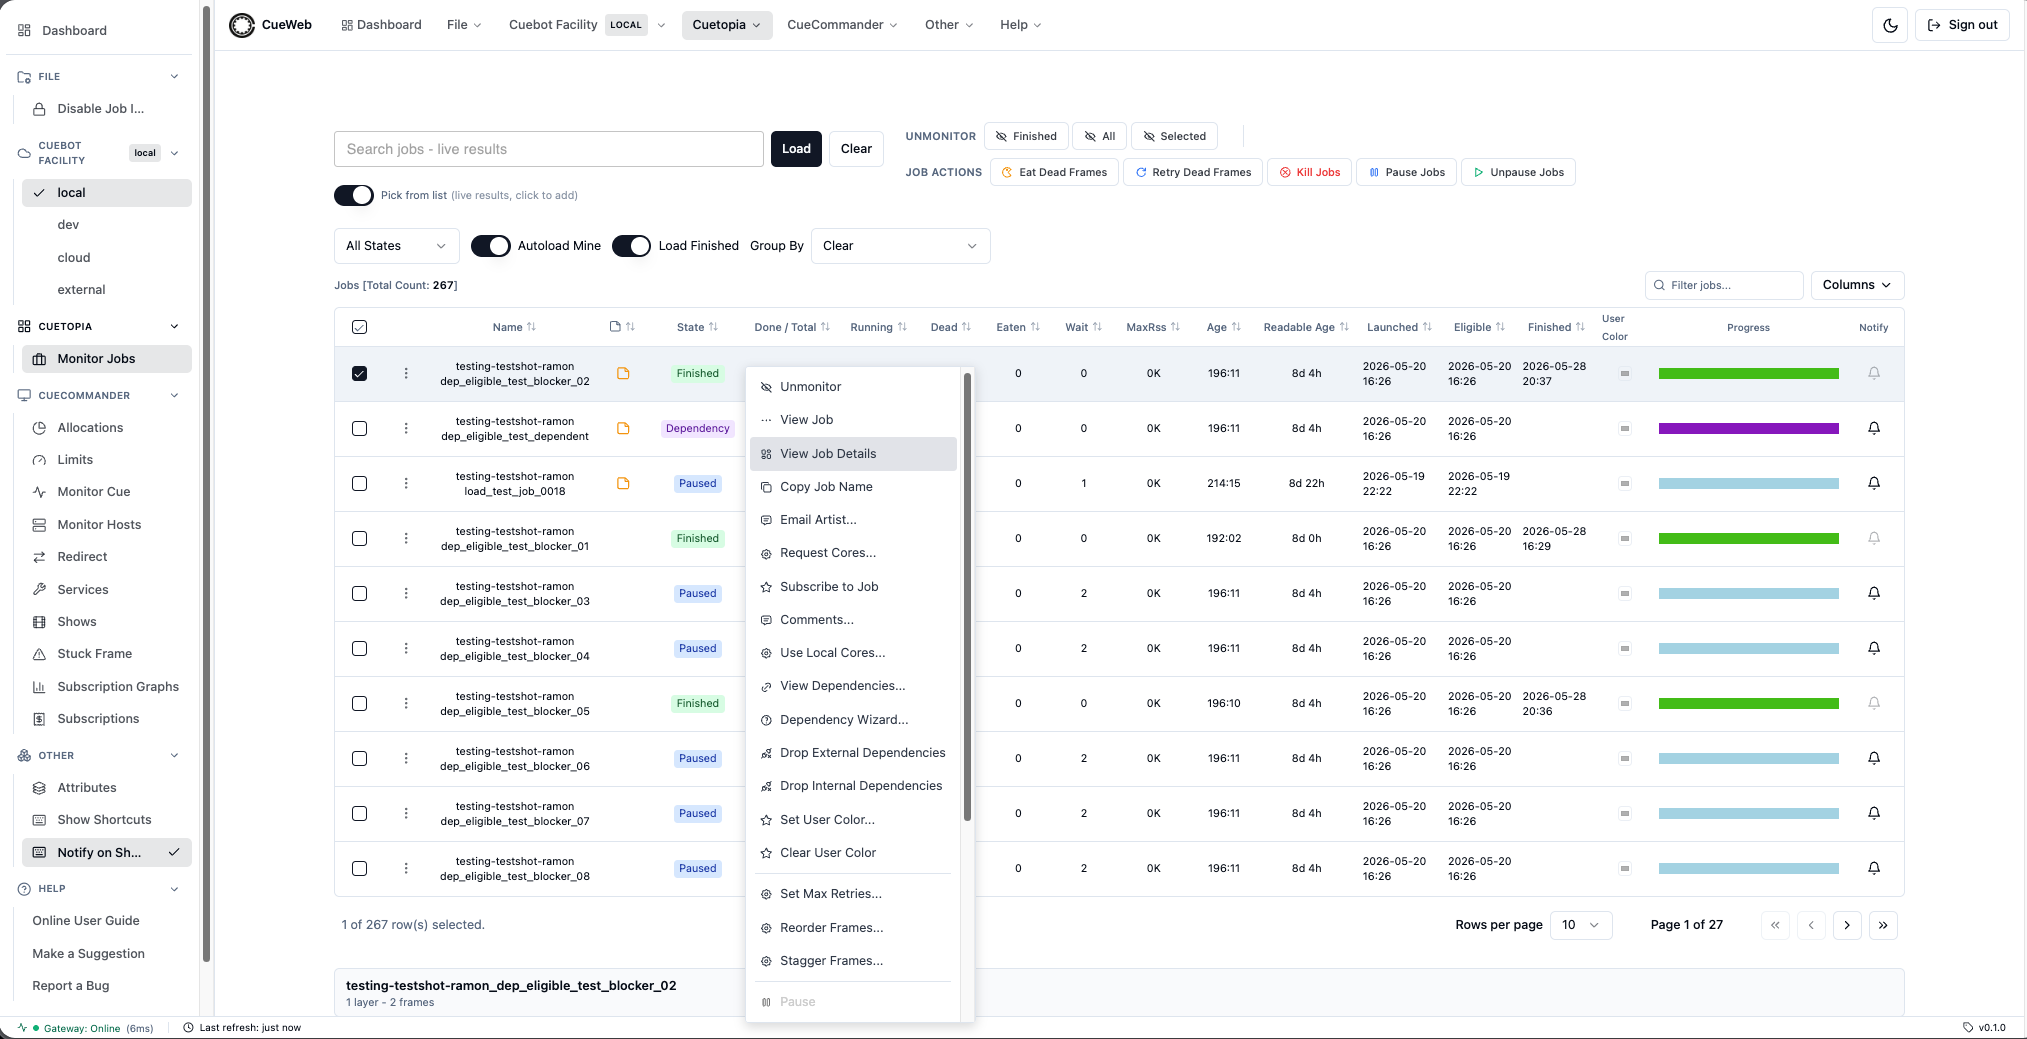
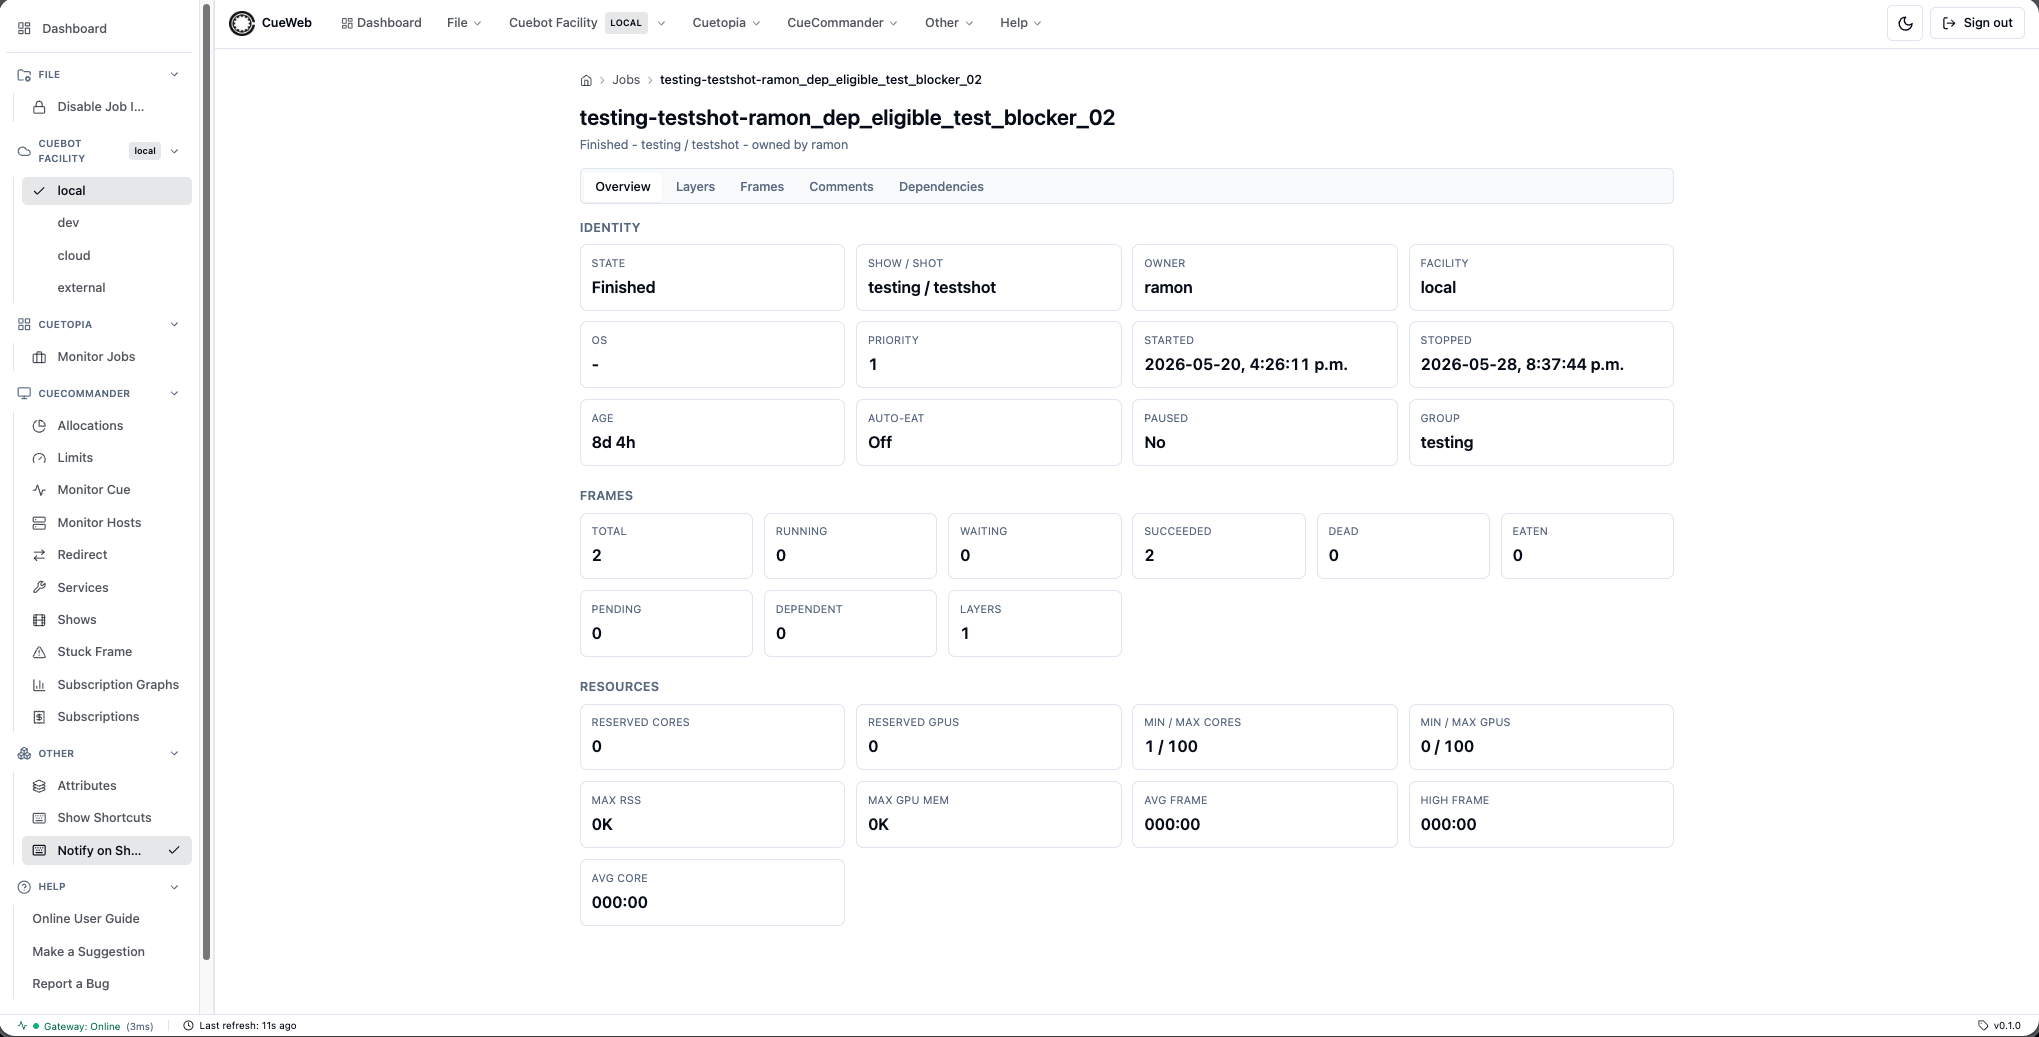
Job Details and Frame Management
Viewing Job Details
CueWeb has two ways to inspect a job:
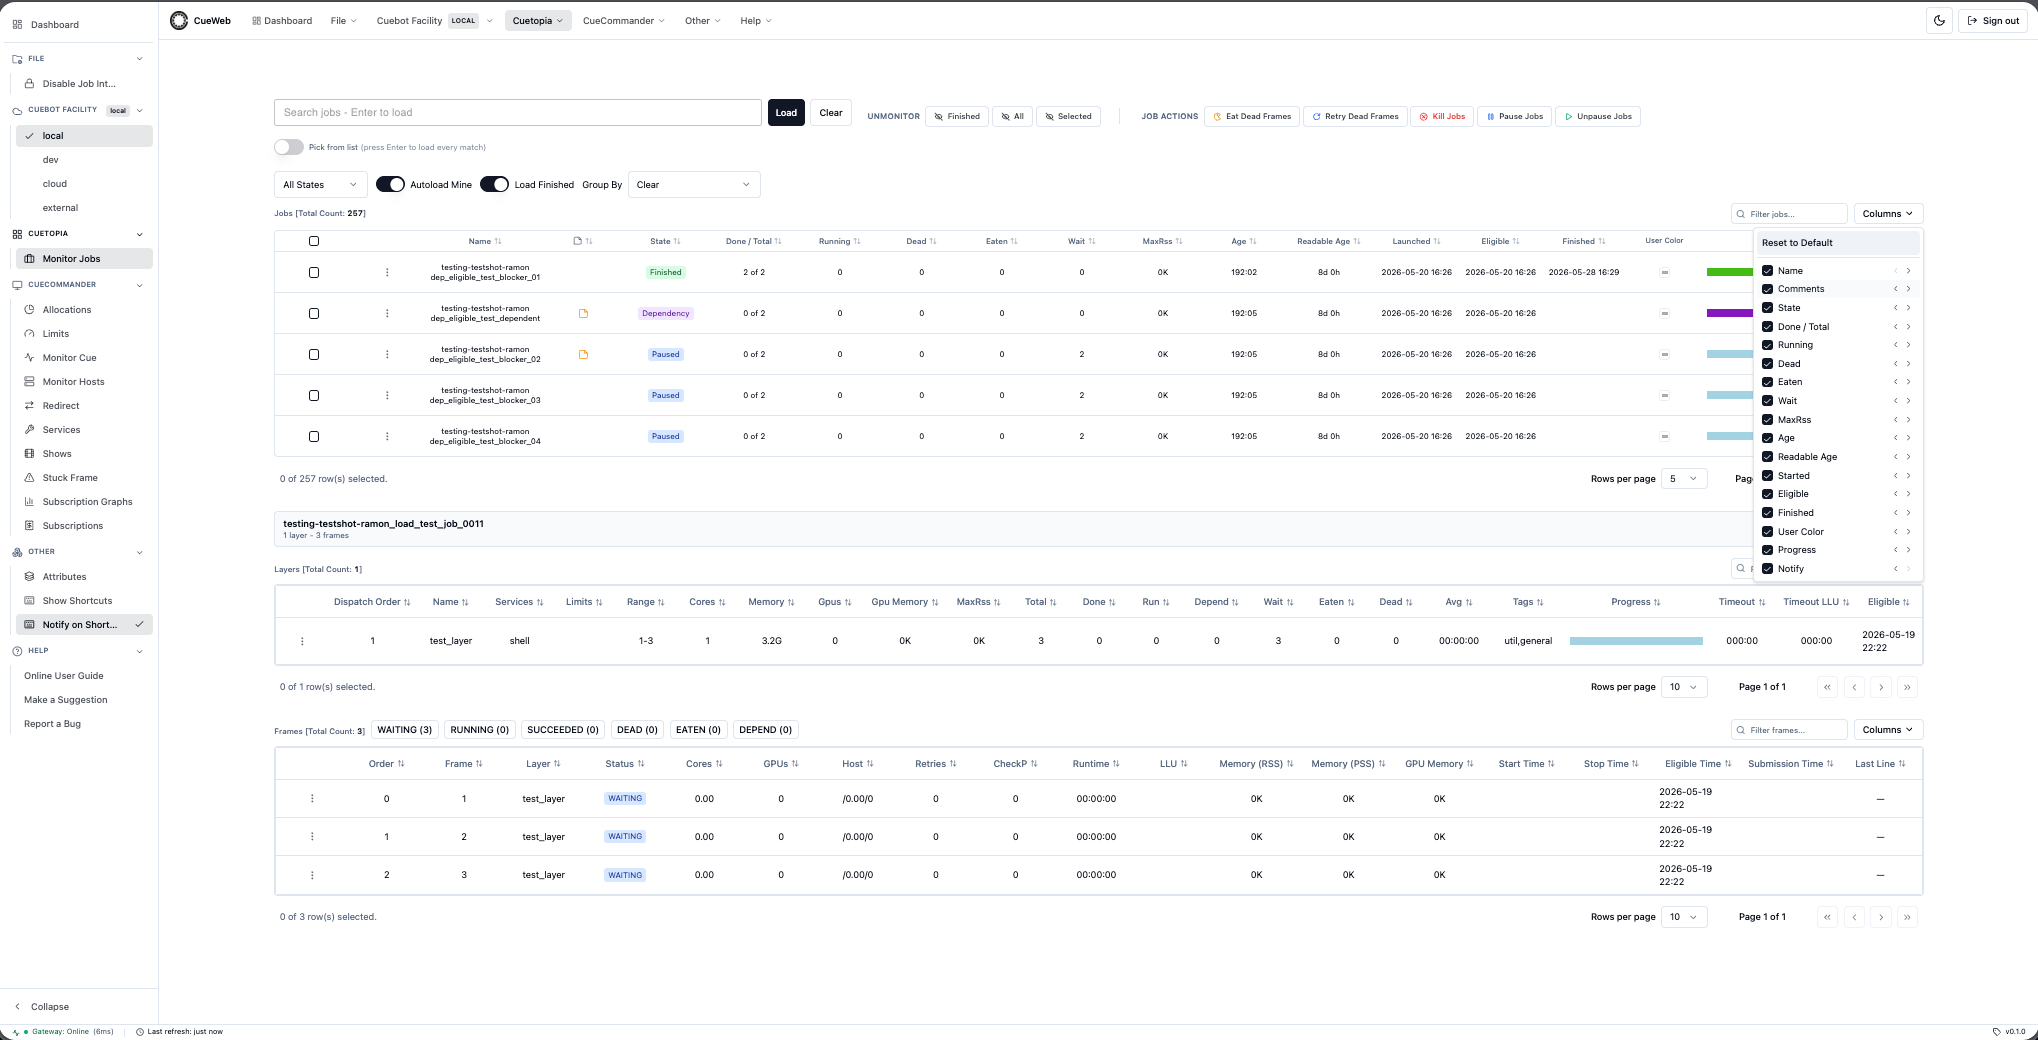
-
Inline panel (quick look): Click a job row in the Jobs table. The associated Layers and Frames tables appear stacked just below the Jobs grid - the CueGUI Monitor Jobs + Monitor Job Details dock layout.
- Tabbed detail page (full inspection): Right-click a job and choose View Job Details (or tap the row’s
⋮Actions button on a phone). This opens/jobs/<jobName>with five tabs:- Overview: identity, frame and resource summary.
- Layers: full Layers table.
- Frames: full Frames table with the same filter chips and column controls.
- Comments: preview of the job’s comments with a link out to the full Comments editor.
- Dependencies: placeholder for the dependency graph view.
The active tab is stored in the URL as
?tab=<key>, so the page is bookmarkable and the browser back / forward buttons walk between tabs.
- To view notes attached to a job, open Comments:
- Right-click the job row and choose Comments, or click the sticky-note icon in the Jobs table’s dedicated Comments column (right after Name) when the job already has comments.
- The Jobs table’s Comments column is sortable - click the column header to pull jobs with comments to the top.
- The Comments page mirrors the CueGUI Comments dialog: comment list (Subject / User / Date), a markdown-rendered preview, an editor for the selected comment, and
New/Save changes/Deletebuttons. - A Use a predefined comment… dropdown applies, adds, edits, or deletes per-browser comment macros.
- Only a comment’s author may edit or delete it; other users see it read-only.
The View Job Details menu item and the tabbed detail page (Overview / Layers / Frames):
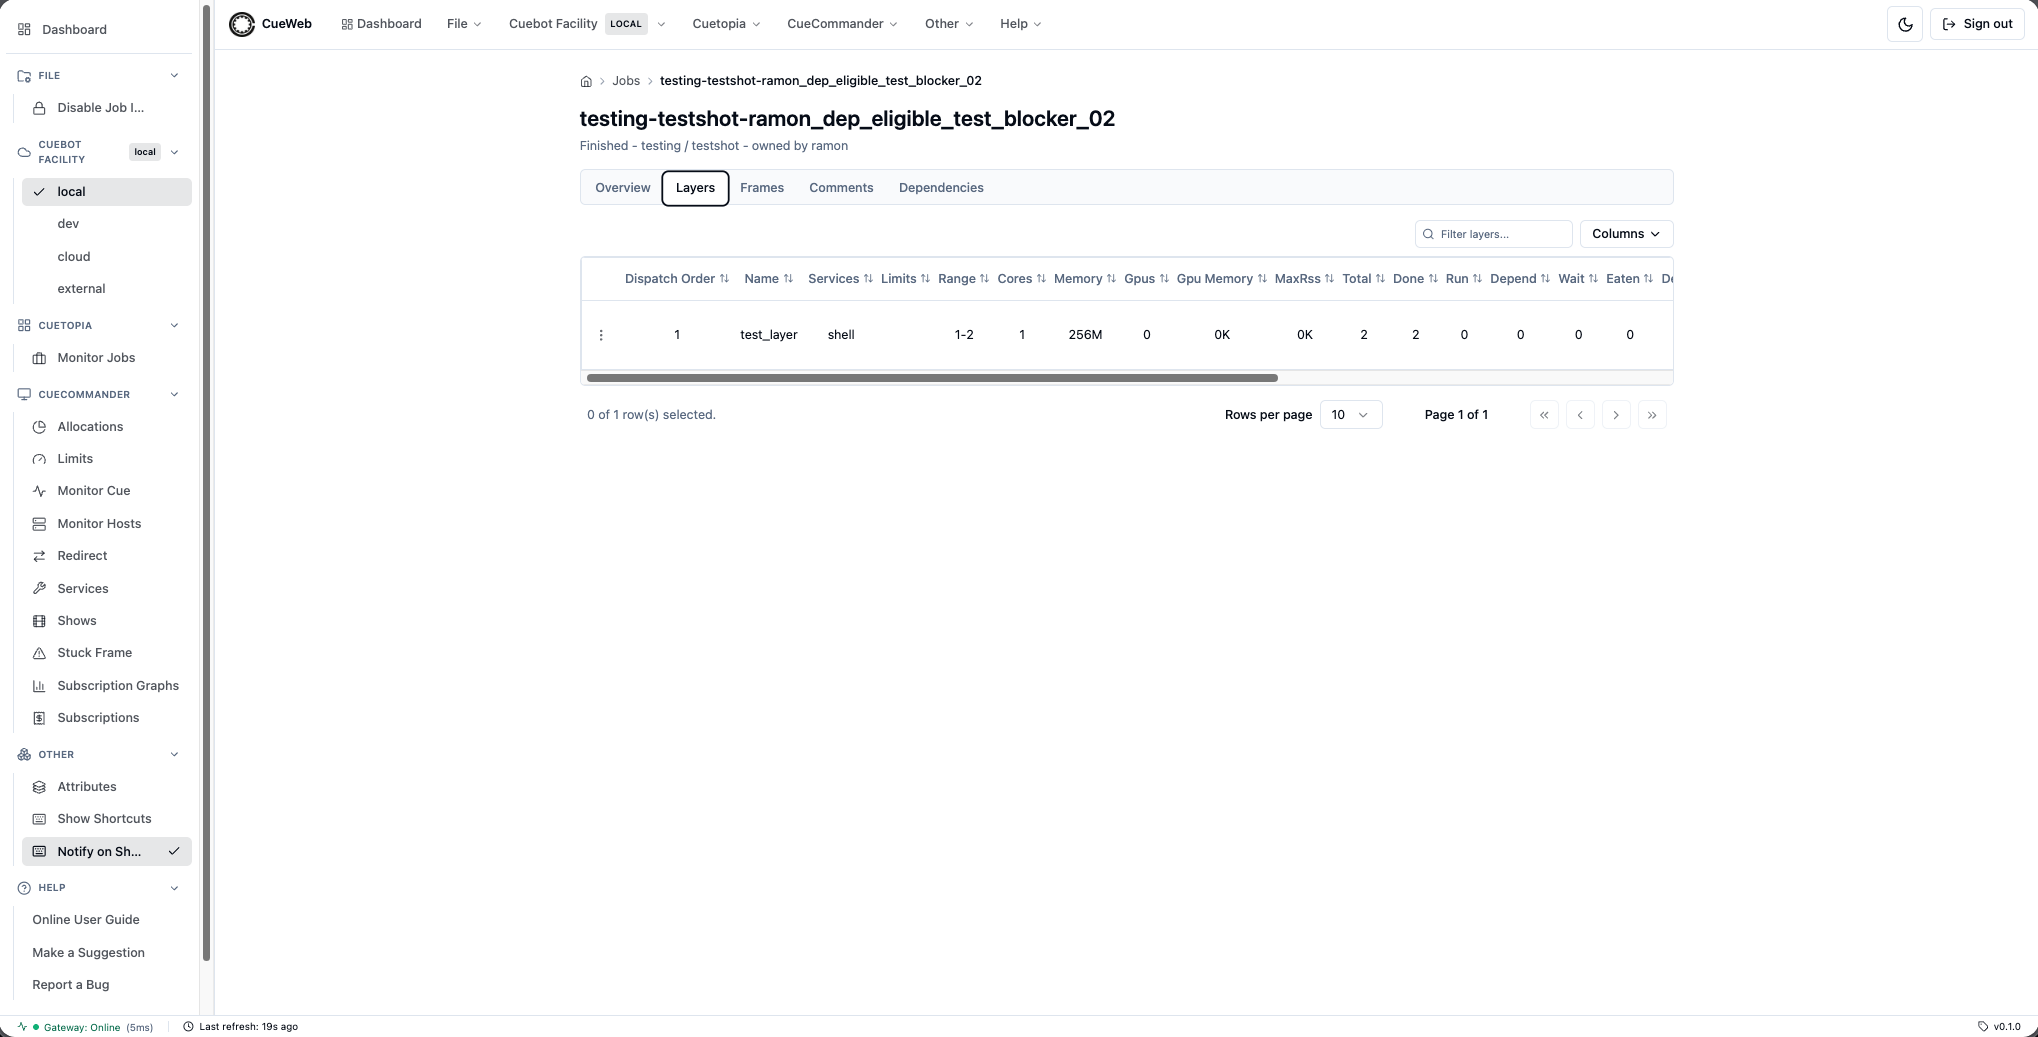
Understanding Layers
Each job contains one or more layers representing different render passes:
- Layer Information:
- Layer name and type
- Frame range (start-end frames)
- Core and memory requirements
- Progress statistics
- Layer Actions:
- Kill all frames in layer
- Retry failed frames
- View frame details
Working with Frames
Frames are the individual rendering tasks within each layer.
Frame Status Colors
- 🟢 Green: Successfully completed
- 🟡 Yellow: Currently running
- 🔴 Red: Failed frames
- ⚫ Gray: Waiting/pending
- 🔵 Blue: Being retried
Frame Operations
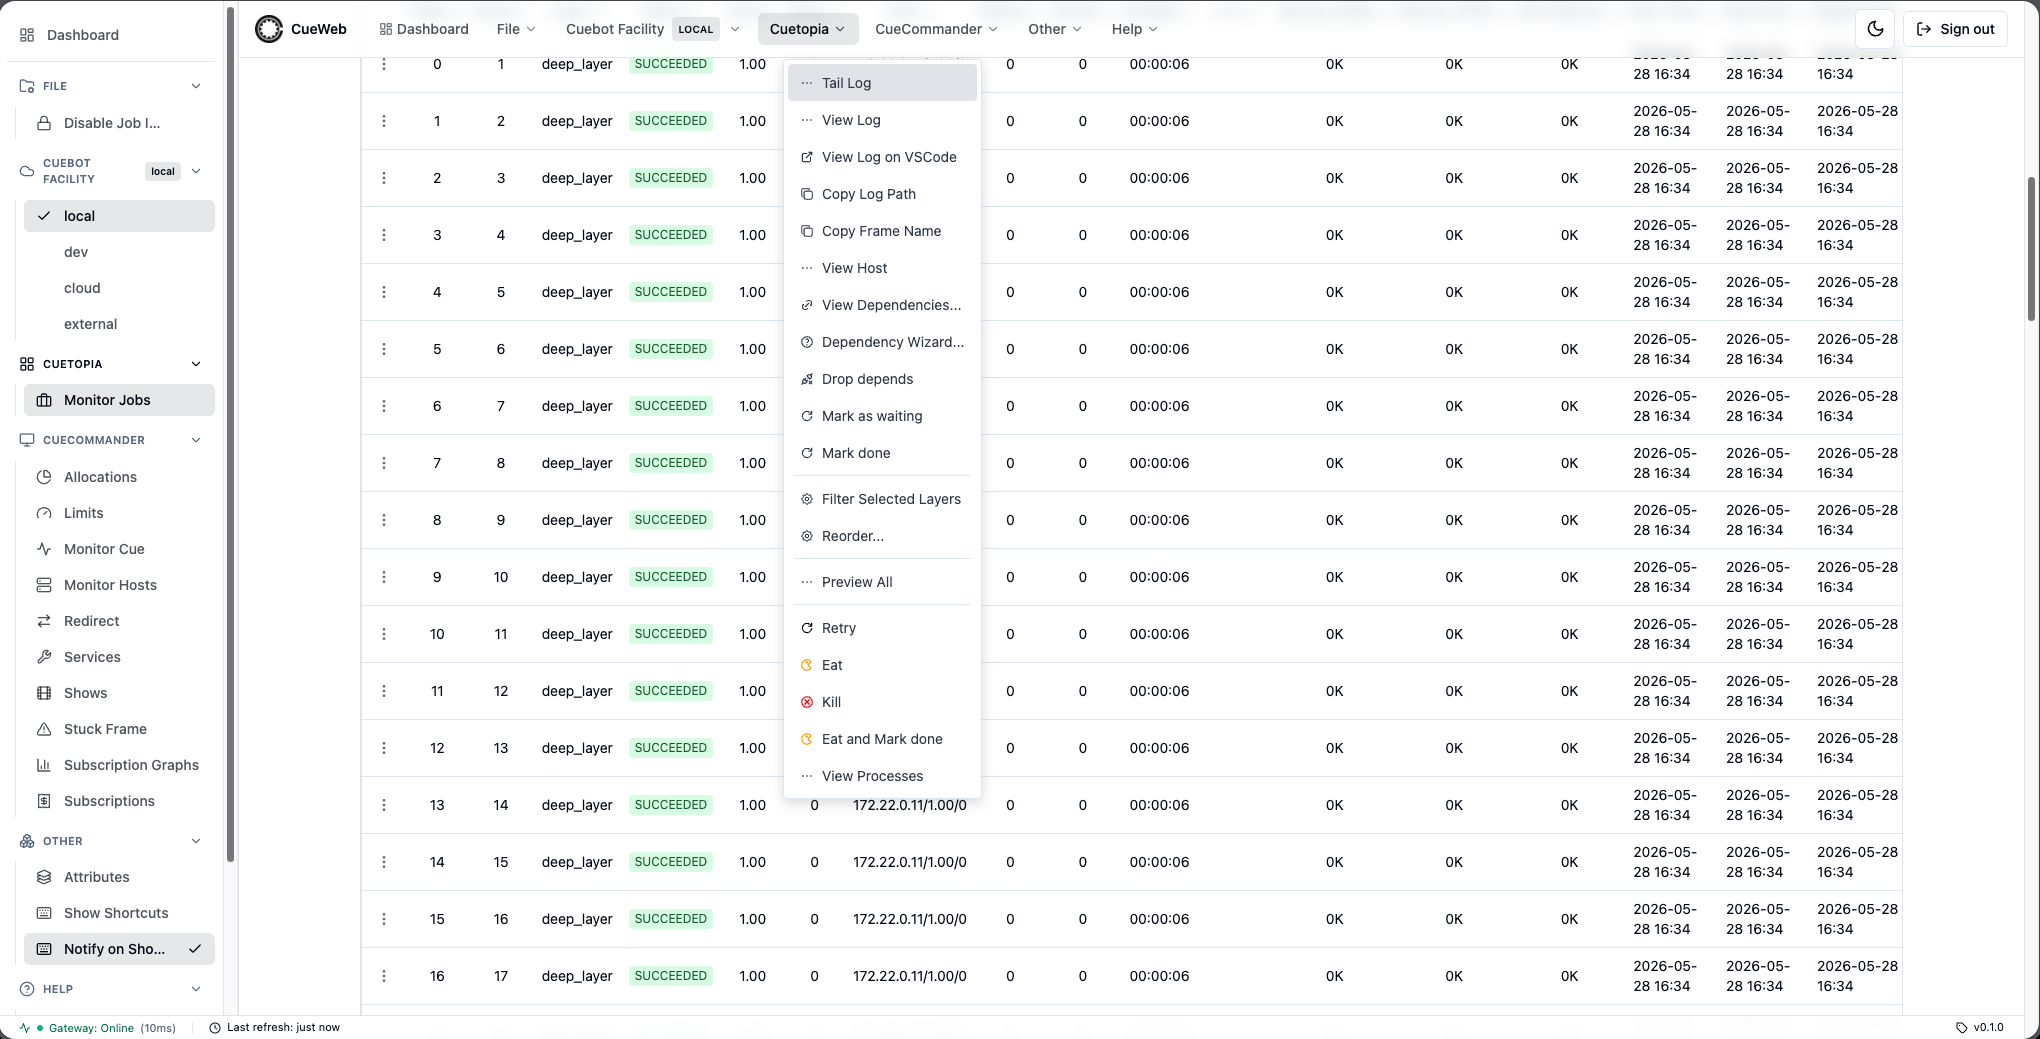
- View Frame Logs:
- Double-click anywhere on the frame row to open the in-browser Monaco log viewer.
- Or right-click → View Log / Tail Log for the same in-browser viewer.
- On touch devices, tap the row’s
⋮Actions button (leftmost cell) → View Log. - Select log version from the dropdown inside the viewer.
- Search the log (highlight + match counter, with case and regex toggles; Enter / Shift+Enter step between matches), turn on follow/tail to auto-scroll new lines (it pauses when you scroll up, with a Jump to bottom button), read absolute line numbers, hover a line to copy just that line, or download the raw log. Choosing Tail Log opens the viewer already following the last ~200 lines.
- The viewer shows an empty-state message when the frame hasn’t started running yet (no log file on disk).
- The viewer works the same whether your deployment reads logs from disk (the default) or from a Loki server (when
NEXT_PUBLIC_LOKI_URLis set, mirroring CueGUI’s Loki log viewer). With the Loki backend, each entry in the Log versions dropdown is a separate frame attempt (newest first) and a Refresh button reloads the selected attempt. You don’t pick the backend - the deployment does.
- Open Logs in an External Editor (optional):
- If the deployment has
NEXT_PUBLIC_LOG_EDITOR_URLconfigured, the Frame right-click menu also offers View Log on <editor> below View Log. - The sandbox
docker-compose.ymlships withvscode://file{path}as the default → View Log on VSCode. Override the build arg to target Sublime / TextMate / IntelliJ instead (or set it empty to hide the item). - Tapping it launches the rqlog file directly in your desktop editor via the custom URL scheme - the same approach GitHub’s “Open in VSCode” button uses. No need to copy the path and paste it into a terminal.
- If the editor isn’t installed (no app registered for
vscode://,subl://, etc.), CueWeb shows a warning toast after a short timeout pointing you at the alternatives.
- If the deployment has
- Preview rendered frames (optional):
- The Frame menu’s Preview All opens the frame’s rendered output in an external image viewer; the command it shows (and the optional Launch button) come from
NEXT_PUBLIC_PREVIEW_COMMAND/NEXT_PUBLIC_PREVIEW_URL(defaultrv {paths}). - A frame preview thumbnail panel also shows web-renderable output inline. To get real frames in the sandbox, render some with the Blender demo:
python sandbox/load_test_jobs.py blender(orpython sandbox/render_blender_demo.py), which renders an image sequence and registers the layer’s output path.
- The Frame menu’s Preview All opens the frame’s rendered output in an external image viewer; the command it shows (and the optional Launch button) come from
- Retry Failed Frames:
- Right-click on red (failed) frames
- Select “Retry Frame”
- Monitor the frame as it re-enters the queue
- Kill Running Frames:
- Right-click on yellow (running) frames
- Select “Kill Frame”
- Use when frames are stuck or consuming too many resources
- Copy frame metadata:
- Copy Frame Name copies just the frame name (e.g.
0001-test_layer). - Copy Log Path copies the absolute rqlog path so you can paste it into a terminal or another viewer.
- Both work on plain-HTTP LAN deployments (e.g. accessing CueWeb on your phone via the Mac’s LAN IP), not just
localhost.
- Copy Frame Name copies just the frame name (e.g.
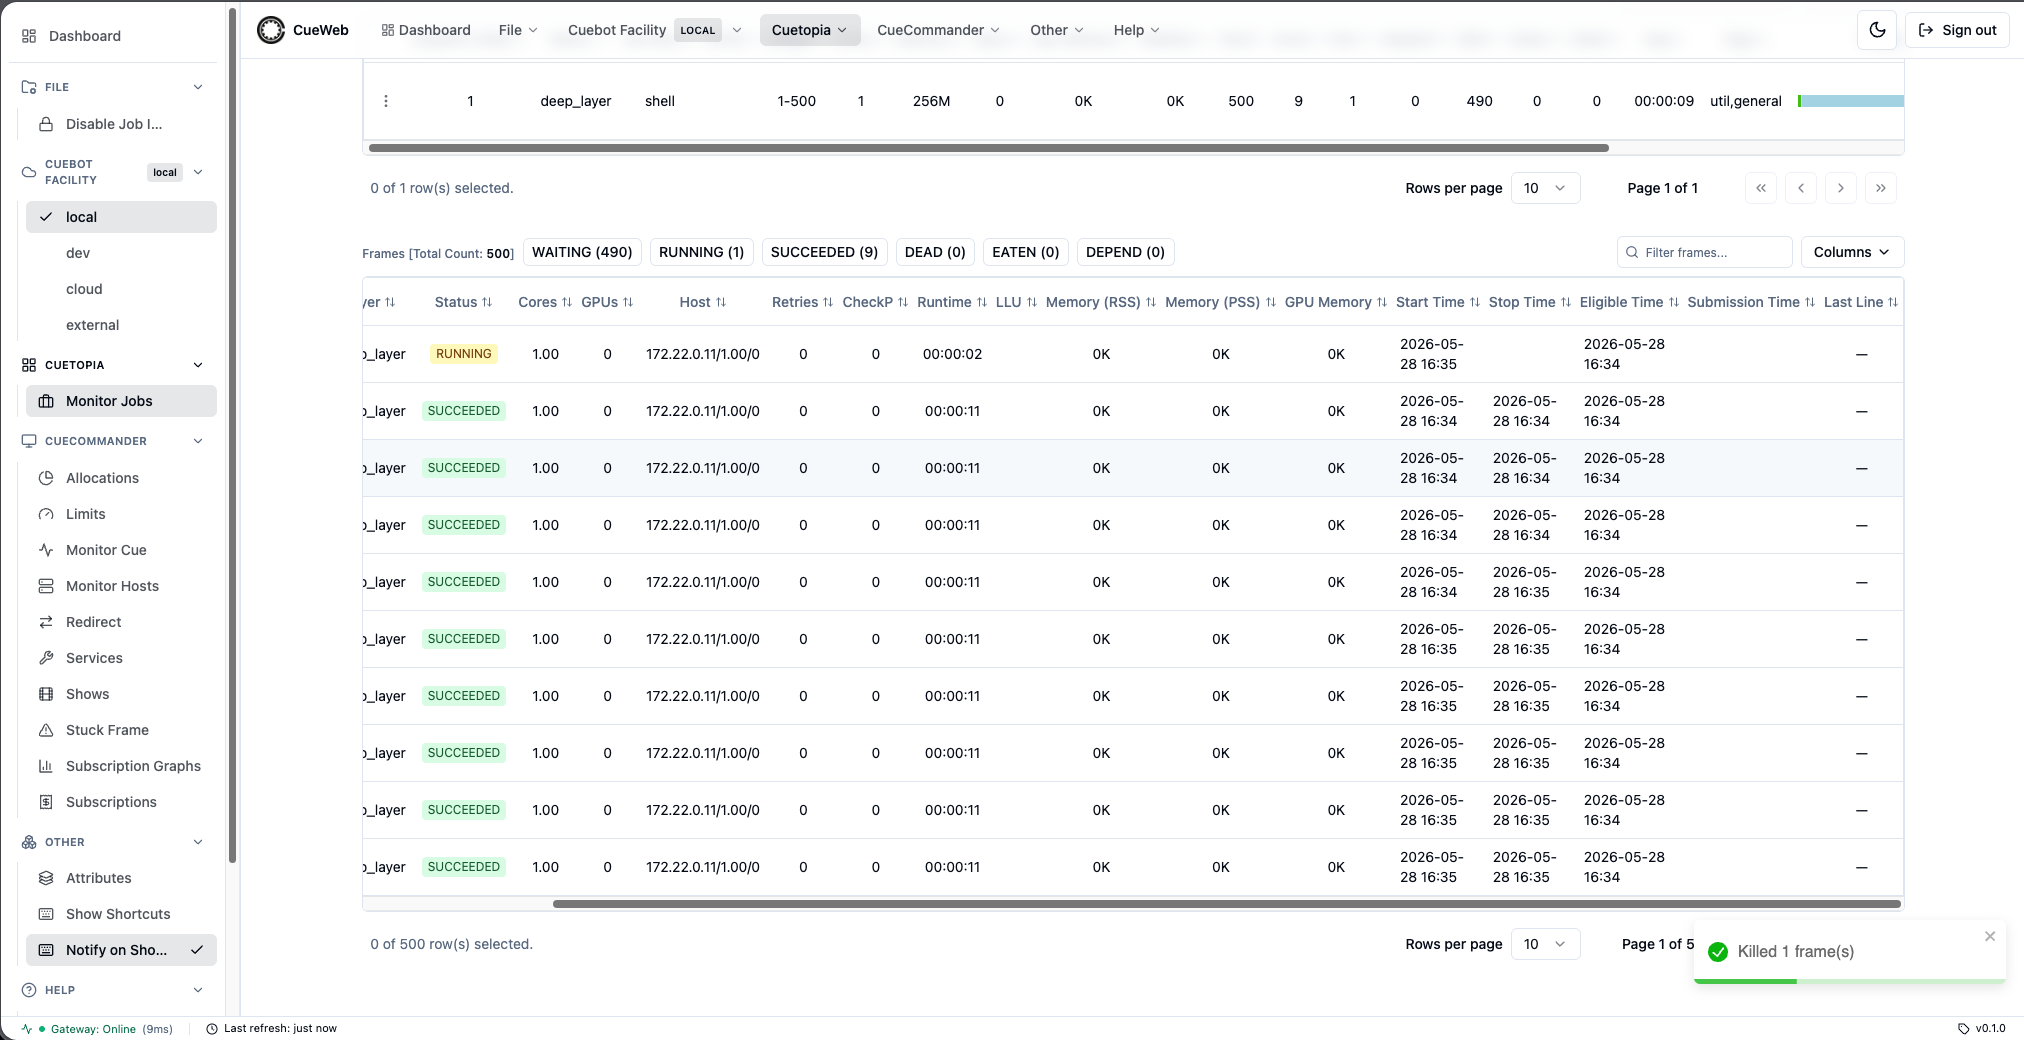
- Filter by Frame State:
- The chips above the frames table —
WAITING,RUNNING,SUCCEEDED,DEAD,EATEN,DEPEND— show the count for each state and act as toggles. - Click one or more chips to filter; multiple selections are combined with OR.
- The current selection is mirrored to the URL as
?frameStates=..., so the filtered view can be bookmarked or shared. - Counts on each chip always reflect the full unfiltered data set.
- The chips above the frames table —
The frame right-click menu, and the confirmation toast shown after an action:
Frame Troubleshooting
- Open job details for a job with failed frames
- Click on the “Frames” tab
- Find a red (failed) frame
- Click on the frame number to view logs
- Look for error messages in the log output
- Right-click the frame and select “Retry”
- Watch the frame change from red to gray (pending)
Finding and clearing stuck frames
Failed frames turn red, but a stuck frame is trickier: it keeps running (gray-green) while no longer making progress - the process is alive but has stopped writing to its log. CueWeb’s Stuck Frames page finds these for you.
-
Open CueCommander → Stuck Frame from the header or sidebar.
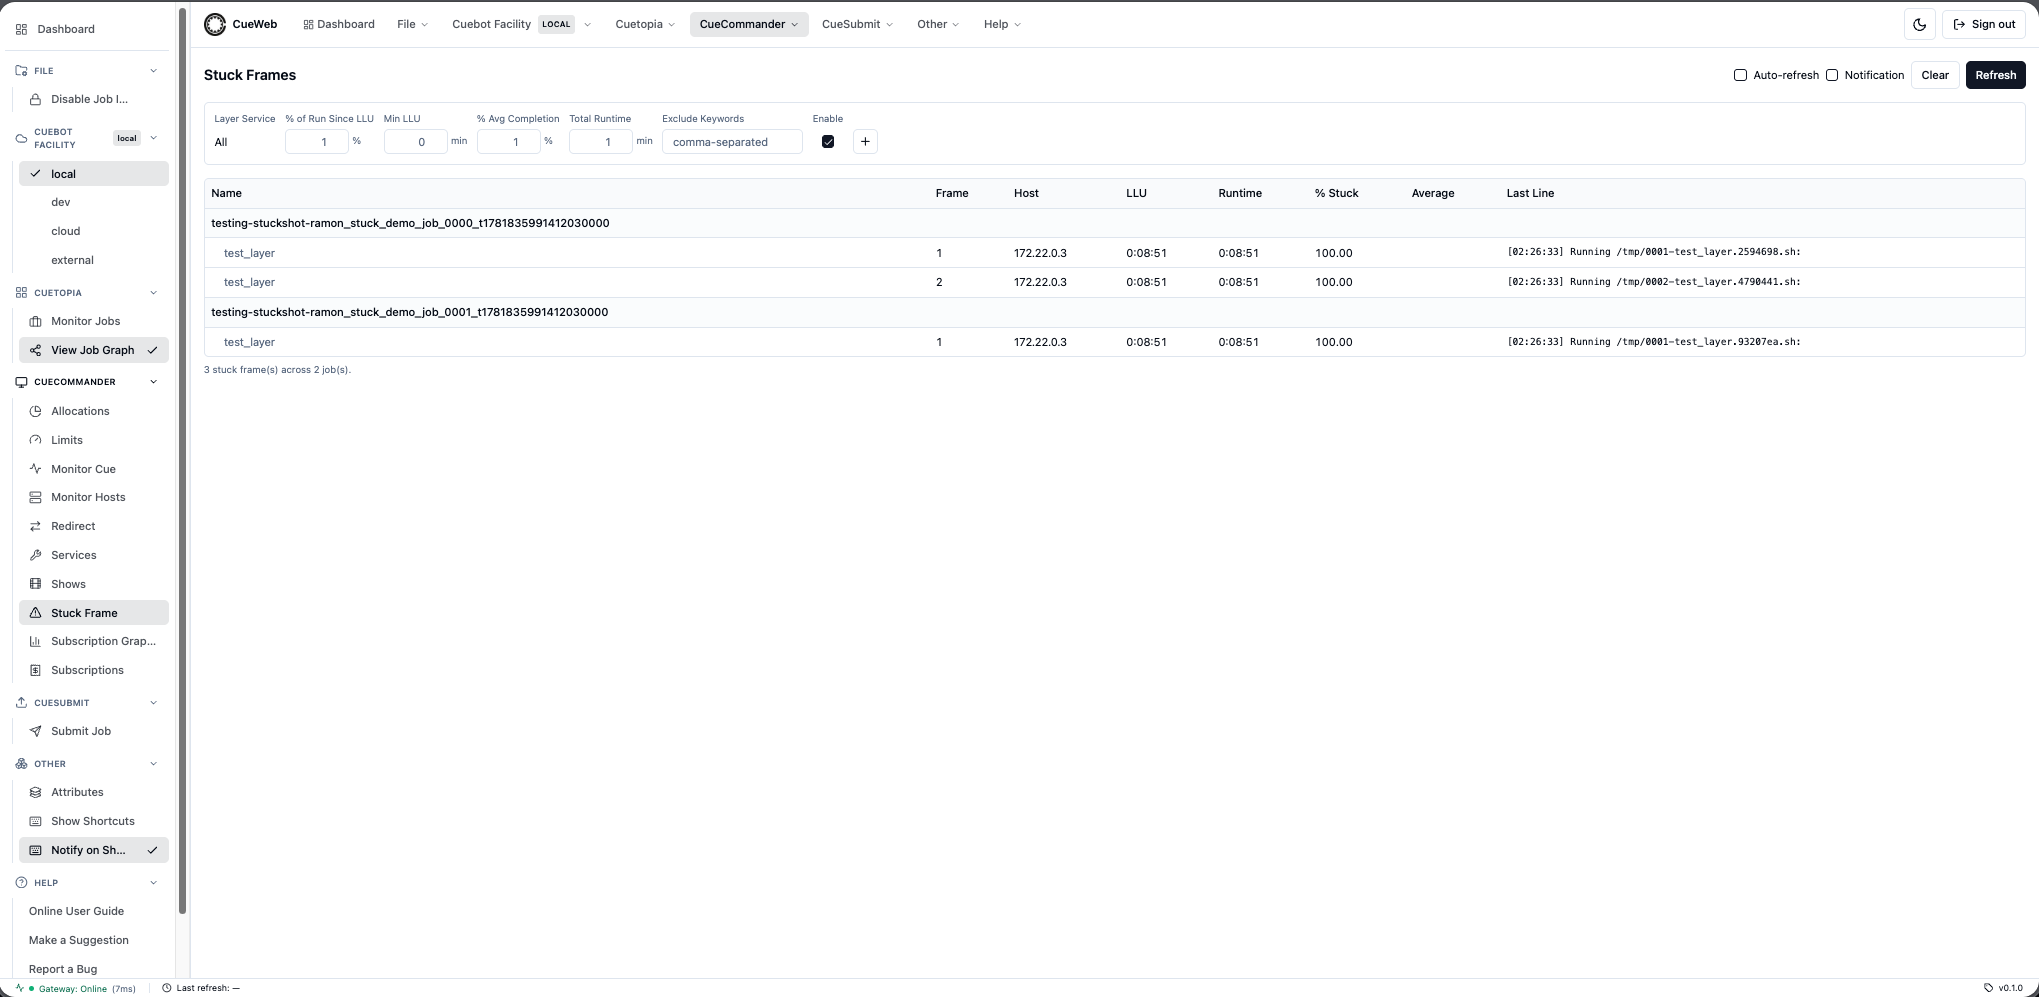
- The page scans every running frame and lists the ones whose log has gone silent relative to their runtime, grouped under their job. Read the LLU (time since the last log line), Runtime, and % Stuck columns to judge each frame - a high % Stuck means the log has been quiet for most of the run.
- If nothing shows up, loosen the filters at the top - lower Min LLU or % of Run Since LLU. To tune detection per render type, click + to add a service-specific filter row (so e.g. Arnold frames, which legitimately run long, use looser limits than quick ones).
- Right-click a frame you believe is hung and pick an action:
- View Log / View Last Log to confirm it has really stalled.
- Retry to requeue it, Eat to mark it done, or Kill to stop it.
- Core Up to raise the layer’s minimum cores when a frame is starved for resources.
- Use Frame Not Stuck (or Job Not Stuck) to dismiss a false positive, or Add Job to Excludes to stop a known-noisy job from appearing.
Advanced Search and Filtering
Basic Search
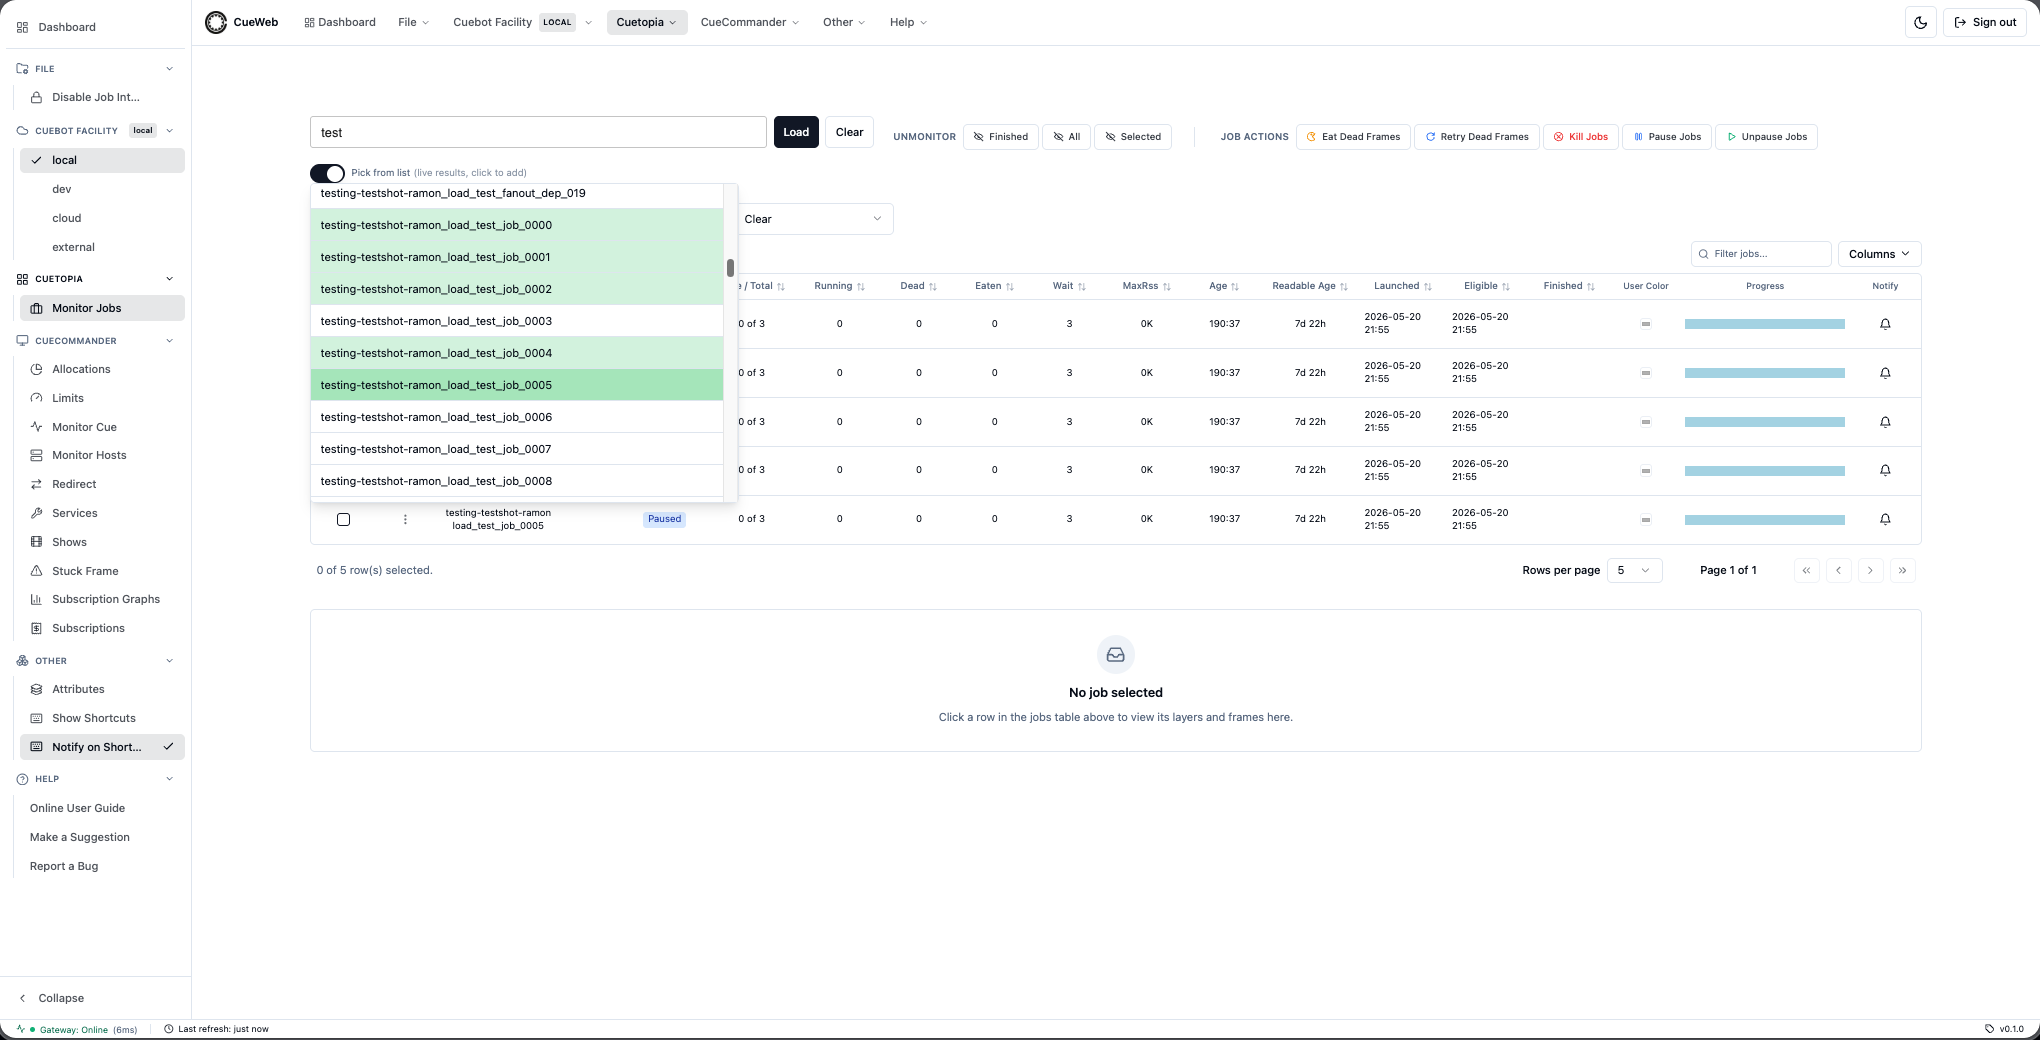
The search bar supports multiple search patterns. As you type, a dropdown suggests matching jobs you can pick from:
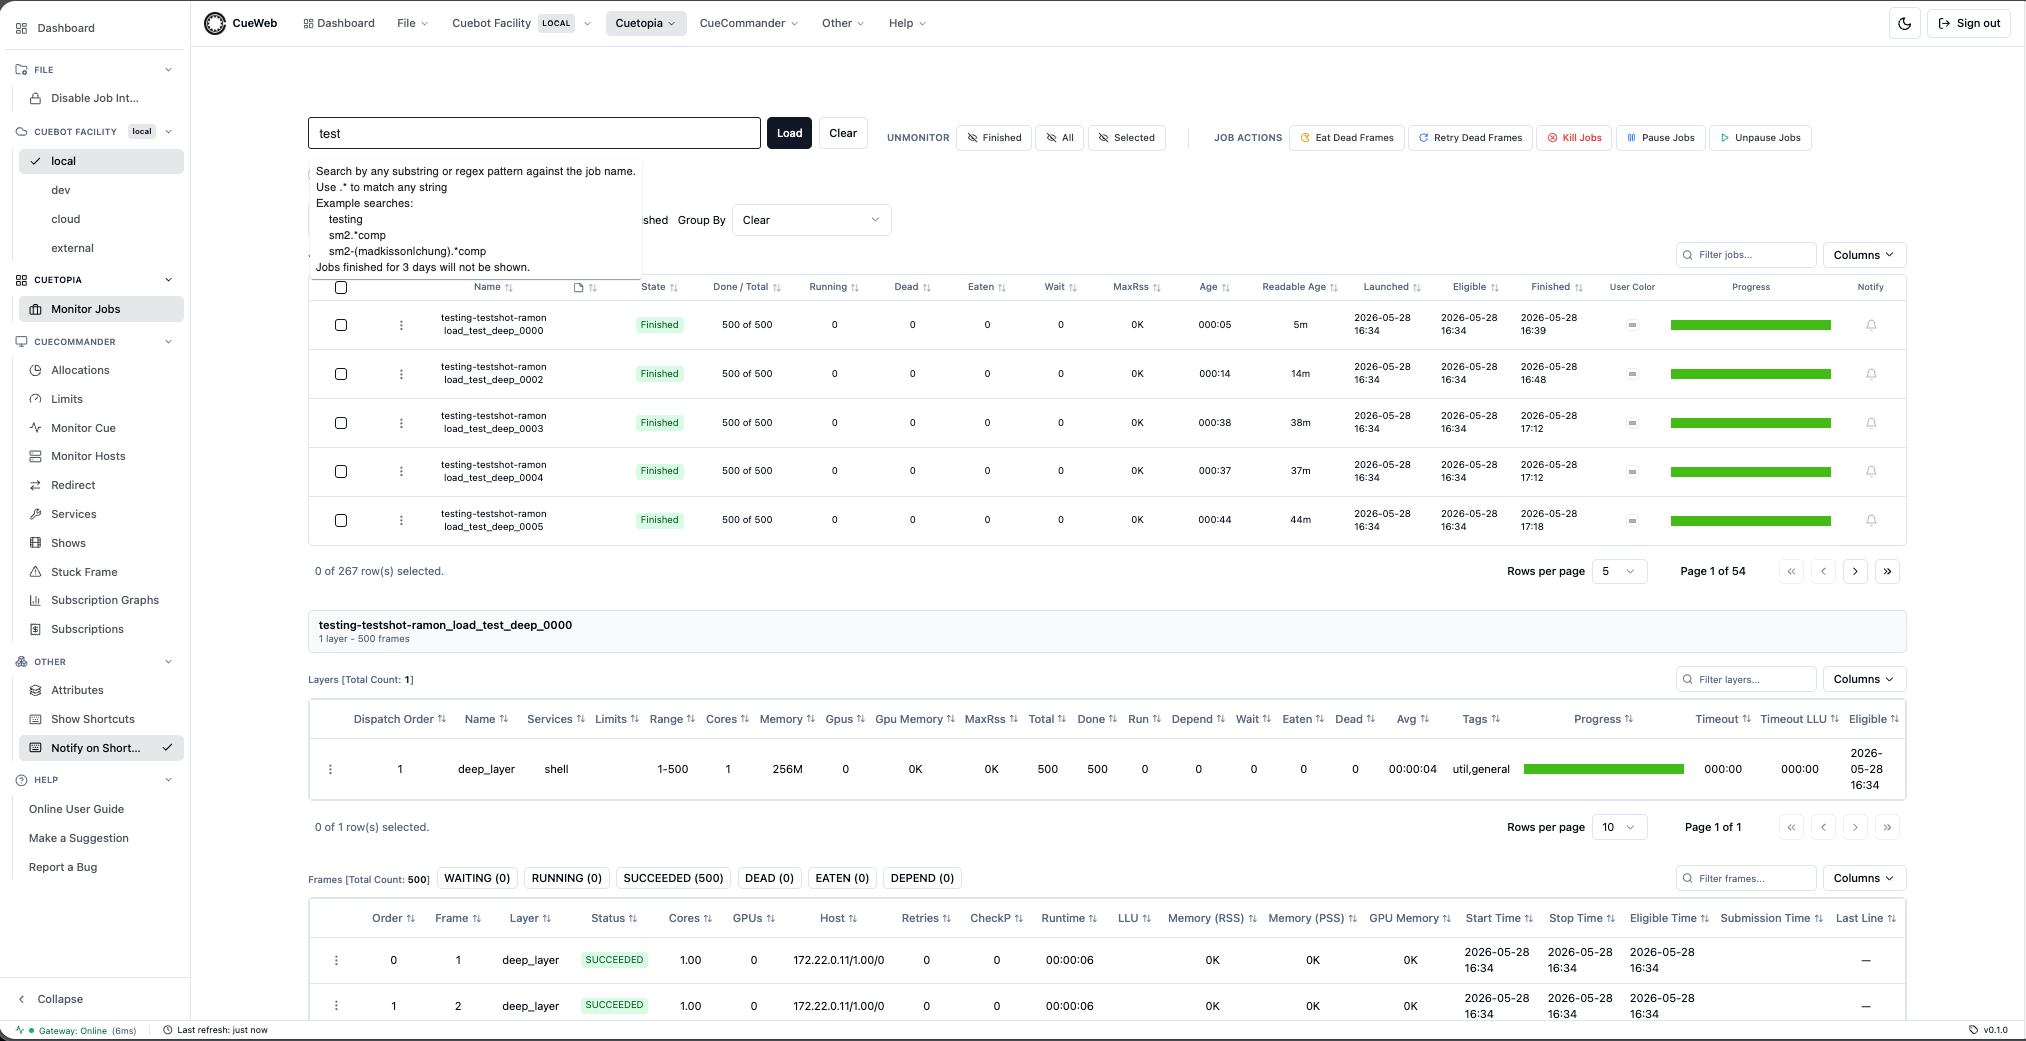
Simple Text Search
# Find jobs containing "comp"
comp

# Find jobs starting with show name
myshow-

# Find specific shot
shot_010
Show-Shot Search
# Find jobs by show-shot pattern
show-shot-

# Find specific shots
myshow-shot_010-
Advanced Regex Search
Prefix searches with ! to enable regex patterns:
Regex Examples
# Find jobs matching pattern
!^myshow-.*comp.*$

# Find jobs with specific frame ranges
!.*_[0-9]{3}-[0-9]{3}_.*

# Find jobs by multiple criteria
!(lighting|comp).*shot_[0-9]+
Search Results Management
- View Suggestions: Type to see dropdown suggestions
- Add to Monitor: Click to add jobs to your dashboard
- Green Indicators: Shows jobs already in your monitor
- Batch Selection: Use checkboxes for multiple jobs
Search Practice
- Basic Search:
- Type your show name followed by a hyphen
- Note the dropdown suggestions
- Select a job to add to monitoring
- Show-Shot Search:
- Search using
show-shot-pattern for show-based filtering - Try
myshow-to find jobs from a specific show
- Search using
- Regex Search:
- Use
!.*lighting.*to find lighting jobs - Try
!^[a-z]+_shot_[0-9]+for pattern matching
- Use
Table Customization
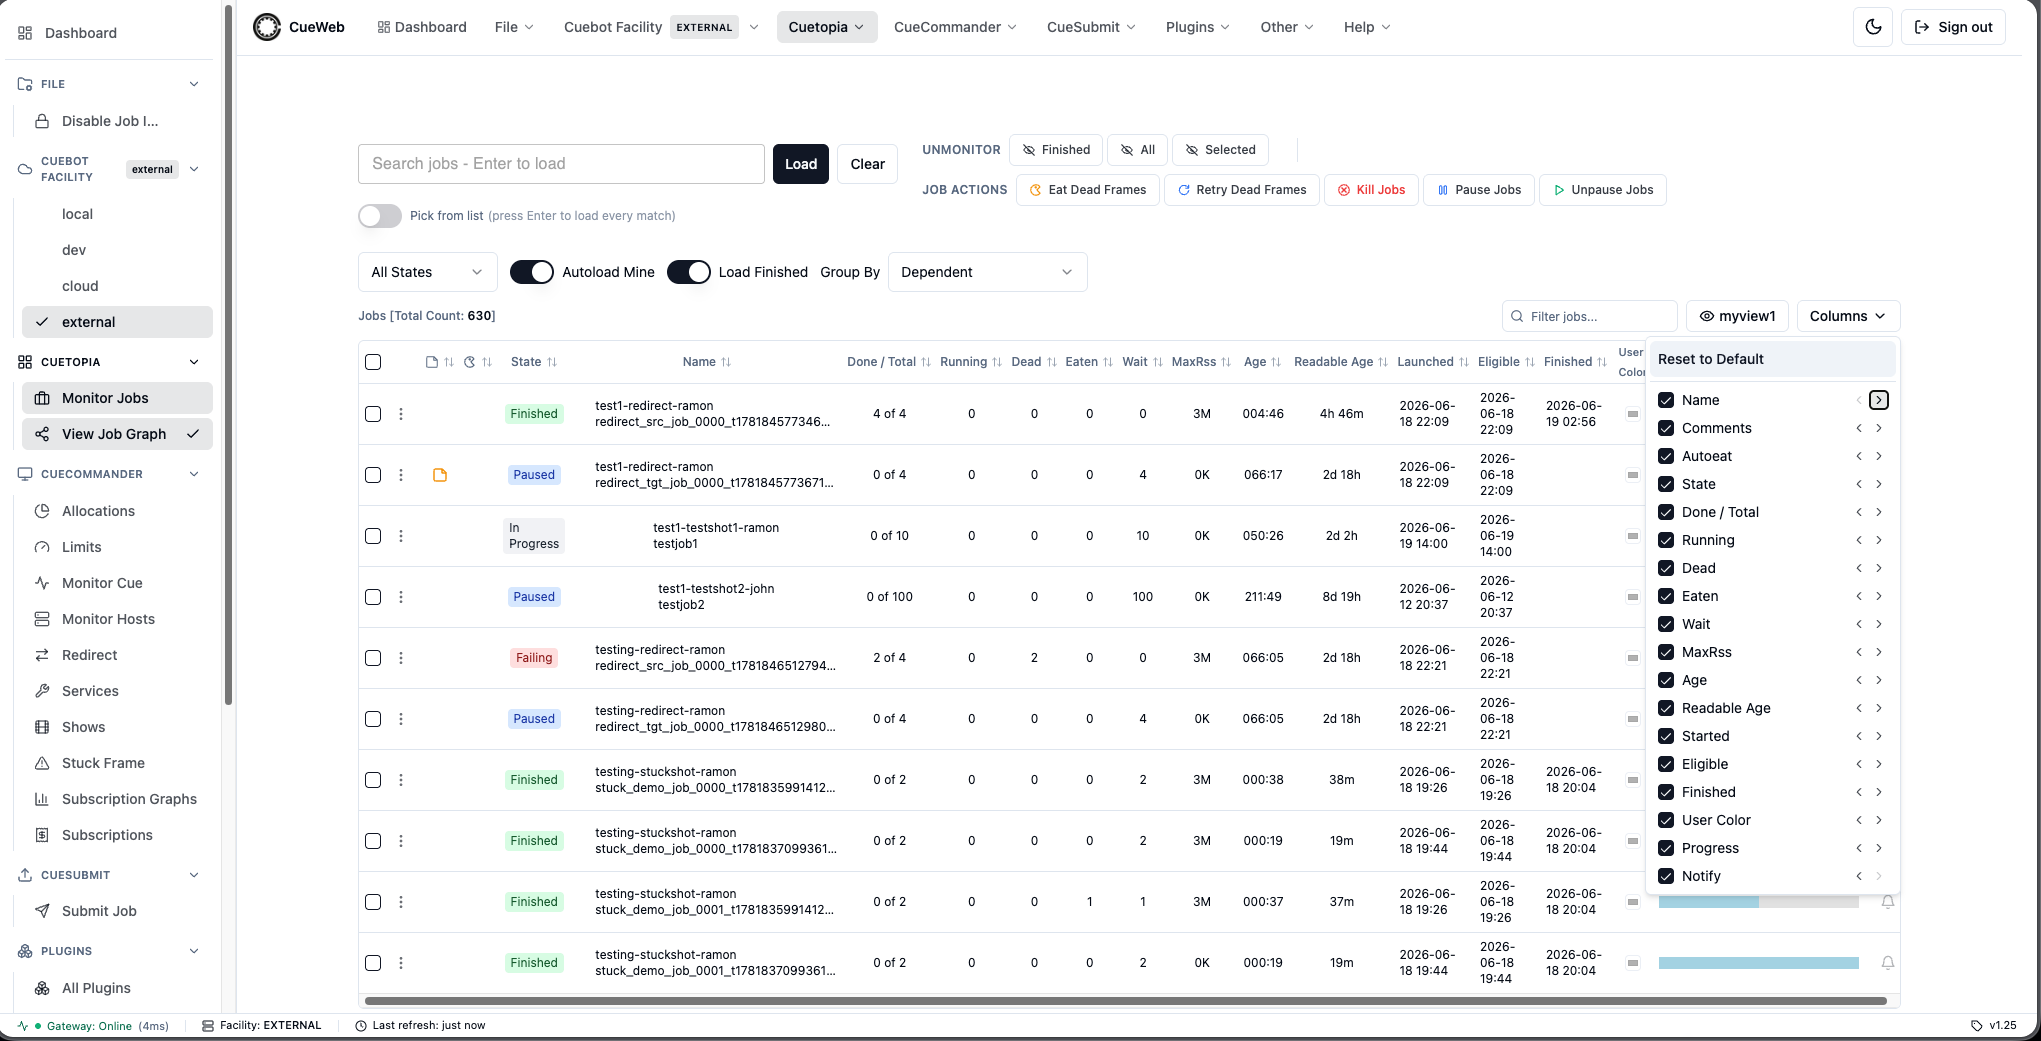
Column Management
Each of the three data tables (Jobs, Layers, Frames) has its own Columns dropdown in the per-table toolbar.
- Show / Hide columns:
- Open the Columns dropdown.
- Toggle the checkbox next to any column to hide / show it.
- Reorder columns left / right:
- In the same dropdown, each row has a
←button (move column one slot left) and a→button (move it one slot right). Non-hideable system columns (the row-select checkbox) stay anchored, so swaps never reach across them.
- In the same dropdown, each row has a
- Reset to default:
- The pinned Reset to Default button at the top clears both column visibility AND order in one click.
- Filter the loaded rows:
- The Filter … input next to the Columns dropdown performs a case-insensitive substring search across every visible column and narrows the rows already loaded. The table snaps back to page 1 on every keystroke; click the
×button to clear the filter.
- The Filter … input next to the Columns dropdown performs a case-insensitive substring search across every visible column and narrows the rows already loaded. The table snaps back to page 1 on every keystroke; click the
- Sort:
- Click any sortable column header to toggle ascending / descending.
Both visibility and ordering choices are saved per table in your browser and survive reloads, navigations, and redeployments.
Real-time Monitoring
Auto-refresh Settings
- Refresh Interval: CueWeb uses a fixed 5-second update interval for all tables.
- Job-finished Notifications: Subscribe to specific jobs via the bell in the Notify column. A background poller checks each subscribed job every 15 seconds. When the job reaches
FINISHEDan in-app toast fires (always), and a desktop popup is layered on top when you have granted the browser’s notification permission. Subscriptions are saved in your browser and survive page reloads; when several tabs are open for the same job, only one tab shows the notification.
Monitoring Best Practices
Active Job Monitoring
- Filter to Active Jobs: Hide completed jobs for focus
- Sort by Priority: High-priority jobs at the top
- Watch Progress: Monitor completion percentages
- Check Failed Counts: Red numbers indicate problems
Problem Job Identification
- Failed Frame Alerts: Look for red indicators
- Stuck Jobs: Jobs with no progress over time
- Resource Hogs: Jobs using excessive memory/cores
- Long-running Frames: Individual frames taking too long
Mobile and Remote Monitoring
CueWeb is responsive down to phone-sized viewports. Every action available on desktop has a mobile-equivalent path.
Reaching CueWeb from a phone on the same network
- On the machine running CueWeb, find the LAN IP:
ipconfig getifaddr en0on macOS,ip aon Linux. - On the phone (same Wi-Fi), open
http://<lan-ip>:3000in your browser (e.g. Safari or Google Chrome). - The same UI loads. The client builds same-origin relative URLs for every API call, so it works correctly from any host (no rebuild needed). This requires
NEXT_PUBLIC_URL=(empty, the default).
Mobile-specific UI affordances
- Hamburger nav drawer:
- The desktop sidebar is hidden below the
mdbreakpoint (768px). - A hamburger button appears on the LEFT of the global header. Tap it to open a side drawer with every group: Dashboard, File, Cuebot Facility, Cuetopia, CueCommander, Other (Attributes / Immersive (full-screen) / Split view / Show Shortcuts / Notify on Shortcut), Help.
- The drawer auto-closes when you tap a navigation link.
- The desktop sidebar is hidden below the
- Per-row Actions menu (replaces right-click):
- Every Jobs / Layers / Frames row has a small
⋮button as its leftmost cell. - Tap it to open the same context menu the desktop right-click opens: Copy Job / Layer / Frame Name, View Log, View Log on <editor>, Pause / Kill / Eat / Retry, etc.
- Every Jobs / Layers / Frames row has a small
- Horizontally swipeable tables:
- The Jobs / Layers / Frames grids have 15-25 columns each. Phones can’t fit all of them.
- Swipe left/right inside the table to reach off-screen columns.
- Use the Columns dropdown to hide columns you don’t need on small screens (the choice is remembered for next time).
- Tap-to-trigger keyboard shortcuts:
- Open Other ▸ Show Shortcuts from the hamburger drawer.
- Every key badge in the overlay is a real button. Tapping
/focuses the Jobs search box,rrefreshes the table,ttoggles theme,Esccloses the overlay - no physical keyboard needed.
Clipboard, notifications, and external editor on LAN HTTP
- Clipboard works on plain-HTTP LAN access. The browser’s modern clipboard API is restricted to secure contexts (HTTPS /
localhost), but CueWeb automatically uses a legacy copy path when the modern one isn’t available. - Subscribe to Job still works - the in-app toast always fires. The optional desktop popup is skipped on LAN HTTP because the Web Notifications API also requires a secure context; serve CueWeb over HTTPS (self-signed cert is enough) to enable that path.
- View Log on <editor> depends on the user’s device having the URL scheme registered. iOS Safari doesn’t route arbitrary custom schemes to apps the way macOS does, so the in-browser View Log is the reliable path on phones - CueWeb falls back to a warning toast when the scheme isn’t handled.
Submitting a job from CueWeb (CueSubmit tutorial)
This walkthrough mirrors what you would do in the standalone CueSubmit CLI tool, but inside the browser. It assumes the OpenCue sandbox is running on localhost:3000 and you have the testing show registered in cuebot (the default seed data includes it).
Open CueSubmit
Click CueSubmit > Submit Job in the top header. The form opens at /cuesubmit with three main sections (Job Info, Layer Info, Submission Details) plus a read-only Final command preview between them.

Single-layer Shell submission
- Job Info
- Job Name:
tutorial_shell - Show: pick
testingfrom the dropdown - Shot:
test_shot - Facility: leave as
[Default] - Username: pre-filled when you’re signed in. If you want to submit as someone else, tick the Edit checkbox next to the field and type their name.
- Job Name:
- Layer Info
- Layer Name:
layer1 - Frame Spec:
1-3 - Chunk Size:
1 - Memory:
256m(the default; works on the sandbox RQD) - Job Type:
Shell
- Layer Name:
- Shell options (the panel below Layer Info)
- Command To Run:
echo "frame #IFRAME#" && sleep 2. Click the?next to the field for the cuebot token cheatsheet (#IFRAME#is the current frame number).
- Command To Run:
- Watch the Final command preview at the bottom of the panel update per-keystroke. This is exactly what cuebot will execute on each frame.
- Click Submit. CueWeb redirects to the job detail page; the three frames cycle WAITING -> RUNNING -> SUCCEEDED in a few seconds.
Multi-layer chain with a Layer dependency
Use the multi-layer table at the bottom of the form (the Submission Details section) to chain layers.
- Set up the first layer as above (Layer Name
preview, Job TypeShell, Commandecho preview frame #IFRAME#). - Click the + button under the Submission Details table to add a second layer.
- The Layer Info section now edits the new layer. Set Layer Name
final, Frame Spec1-3, Job TypeShell, Commandecho final frame #IFRAME#. In the Dependency Type dropdown pickLayerso thefinallayer waits forpreviewto fully finish. - The table at the bottom now shows two rows. Click either row to flip the editor between them; use
↑ / ↓to reorder; use−to drop the selected layer. - Submit. The detail page shows both layers;
finalstays in DEPEND state untilpreviewcompletes, then dispatches.
Maya / Nuke / Blender layers
Flip Job Type to Maya, Nuke, or Blender to swap the per-type options panel:
- Maya asks for a Maya File (
.ma/.mb) and an optional Camera. The Final command becomesRender -r file -s #FRAME_START# -e #FRAME_END# [-cam CAM] <file>. - Nuke asks for a Nuke File (
.nk) and optional comma-separated Write Nodes. The Final command becomesnuke -F #IFRAME# [-X WriteNodes] -x <file>. - Blender asks for a Blender File (
.blend), an Output Path, and an Output Format. Simple ranges (1-10) use-s/-e/-a; more complex ranges use the per-frame-f #IFRAME#token.
The CueWeb panel always preserves the inputs you typed even when you flip between types, so iterating doesn’t lose your scene path or camera.
Convenience features
- Autocomplete history: start typing in Job Name, Shot, or Layer Name to pull values you’ve used before. The list is kept per-browser, deduped, capped at 25 entries.
- Auto-saved draft: the form’s full state is saved on every keystroke. Refresh the tab - the layers you had configured are still there. The draft is cleared on Cancel, on Reset (after a confirm dialog), and after a successful submit.
- Reset: the Reset button between Cancel and Submit clears every field after a themed confirmation dialog. Autocomplete history is not wiped.
- View in Monitor Jobs: from the detail page that opens after submit, click View in Monitor Jobs in the header to deep-link to Cuetopia with the new job auto-loaded.
Redirecting cores to a job
When a high-priority job is starved for cores, the Redirect tool (CueCommander → Redirect) lets an administrator take cores away from other running work and hand them to that job. Redirecting kills the frames currently running on the chosen procs, so it is a deliberate, admin-level action - not an everyday operation.
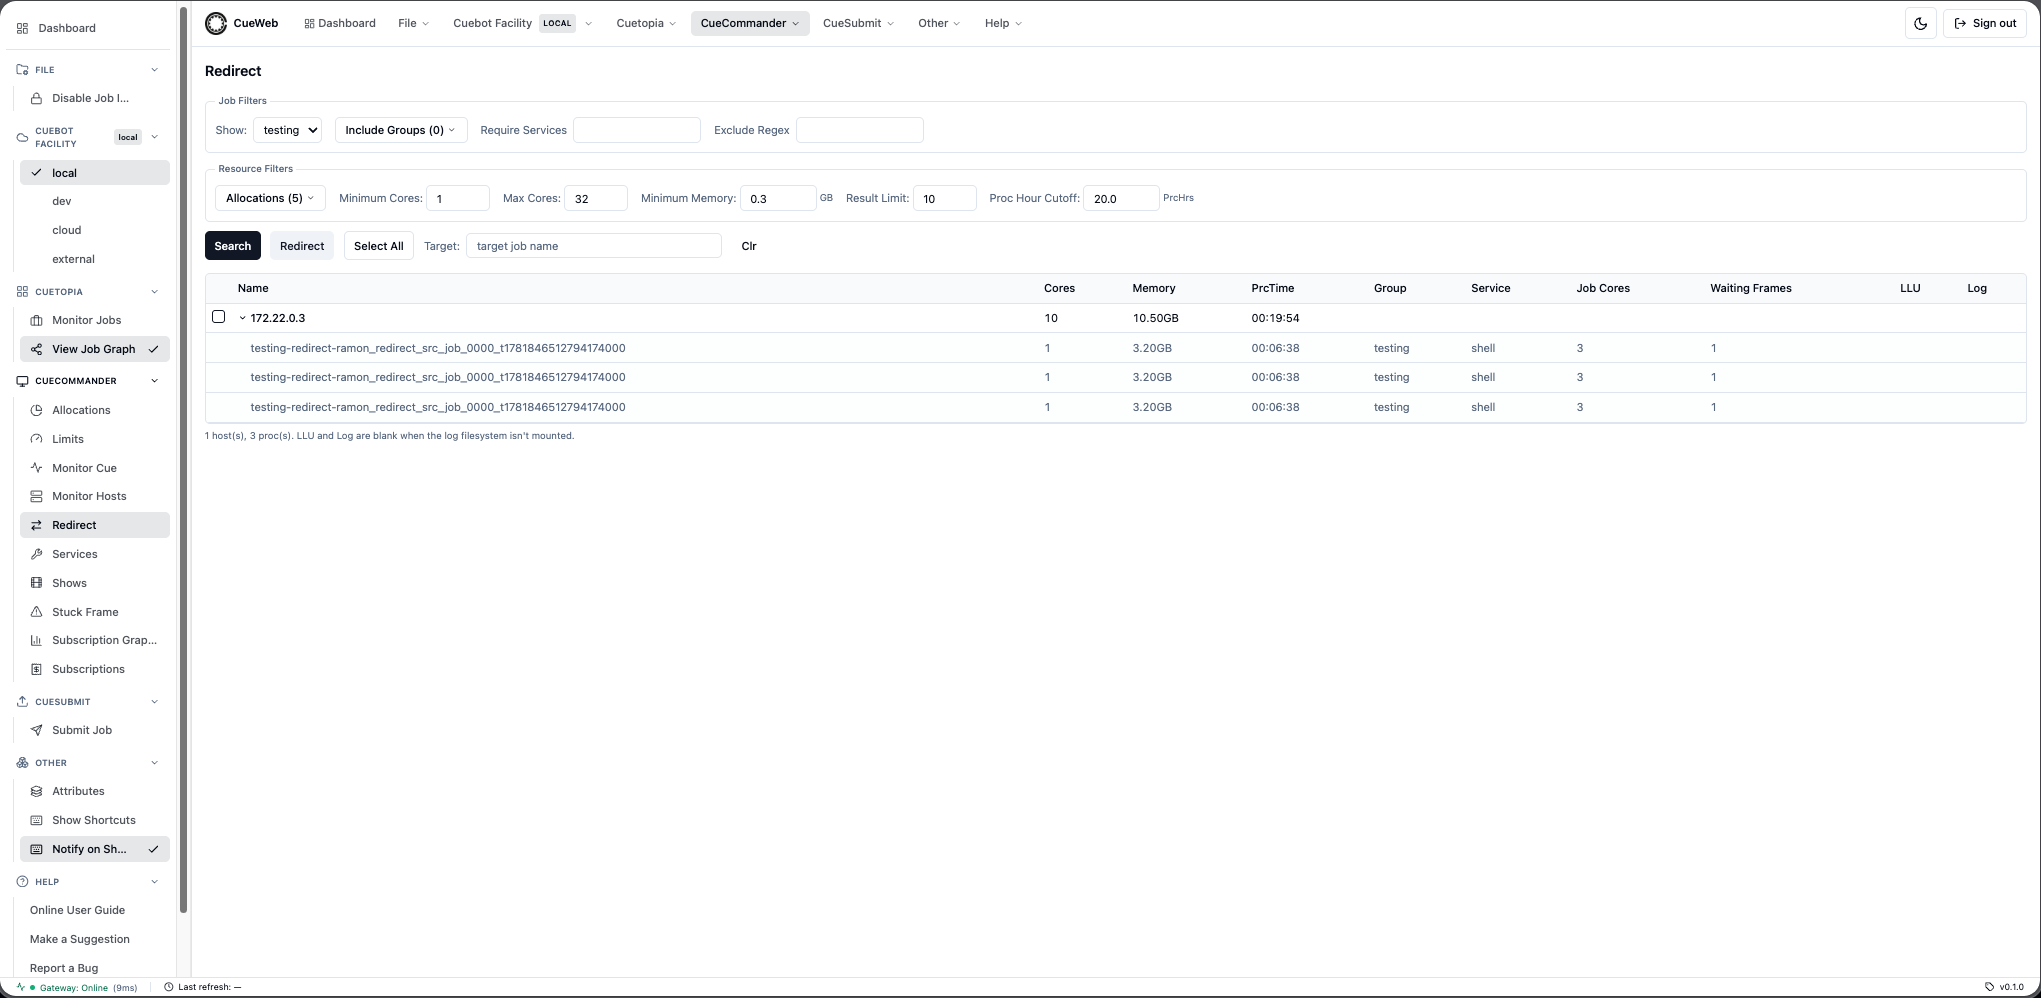
- Open CueCommander → Redirect.
- In the Target field, type the job that should receive the cores. CueWeb resolves it and auto-fills the Show and the Minimum Cores / Minimum Memory from that job’s layers, so the search looks for procs big enough to help.
- Tune the filters:
- Job filters - narrow the candidate procs by Show, Include Groups, Require Services, or an Exclude Regex on the job name.
- Resource filters - set the Allocations, Minimum / Max Cores, Minimum Memory, Result Limit, and a Proc Hour Cutoff so you don’t kill procs that are nearly finished.
- Click Search. CueWeb lists the hosts whose busy procs match; expand a row to see the individual procs (which job/group/service each one is running).
- Tick the hosts you want to take cores from (or Select All), then click Redirect.
-
CueWeb double-checks the target before acting: it refuses if the target job has disappeared, has no waiting frames, or is already at its max cores, and it asks you to confirm if the target is paused or if a selected proc belongs to a different show (that show’s frame would be killed). On success the freed cores are booked onto your target job.
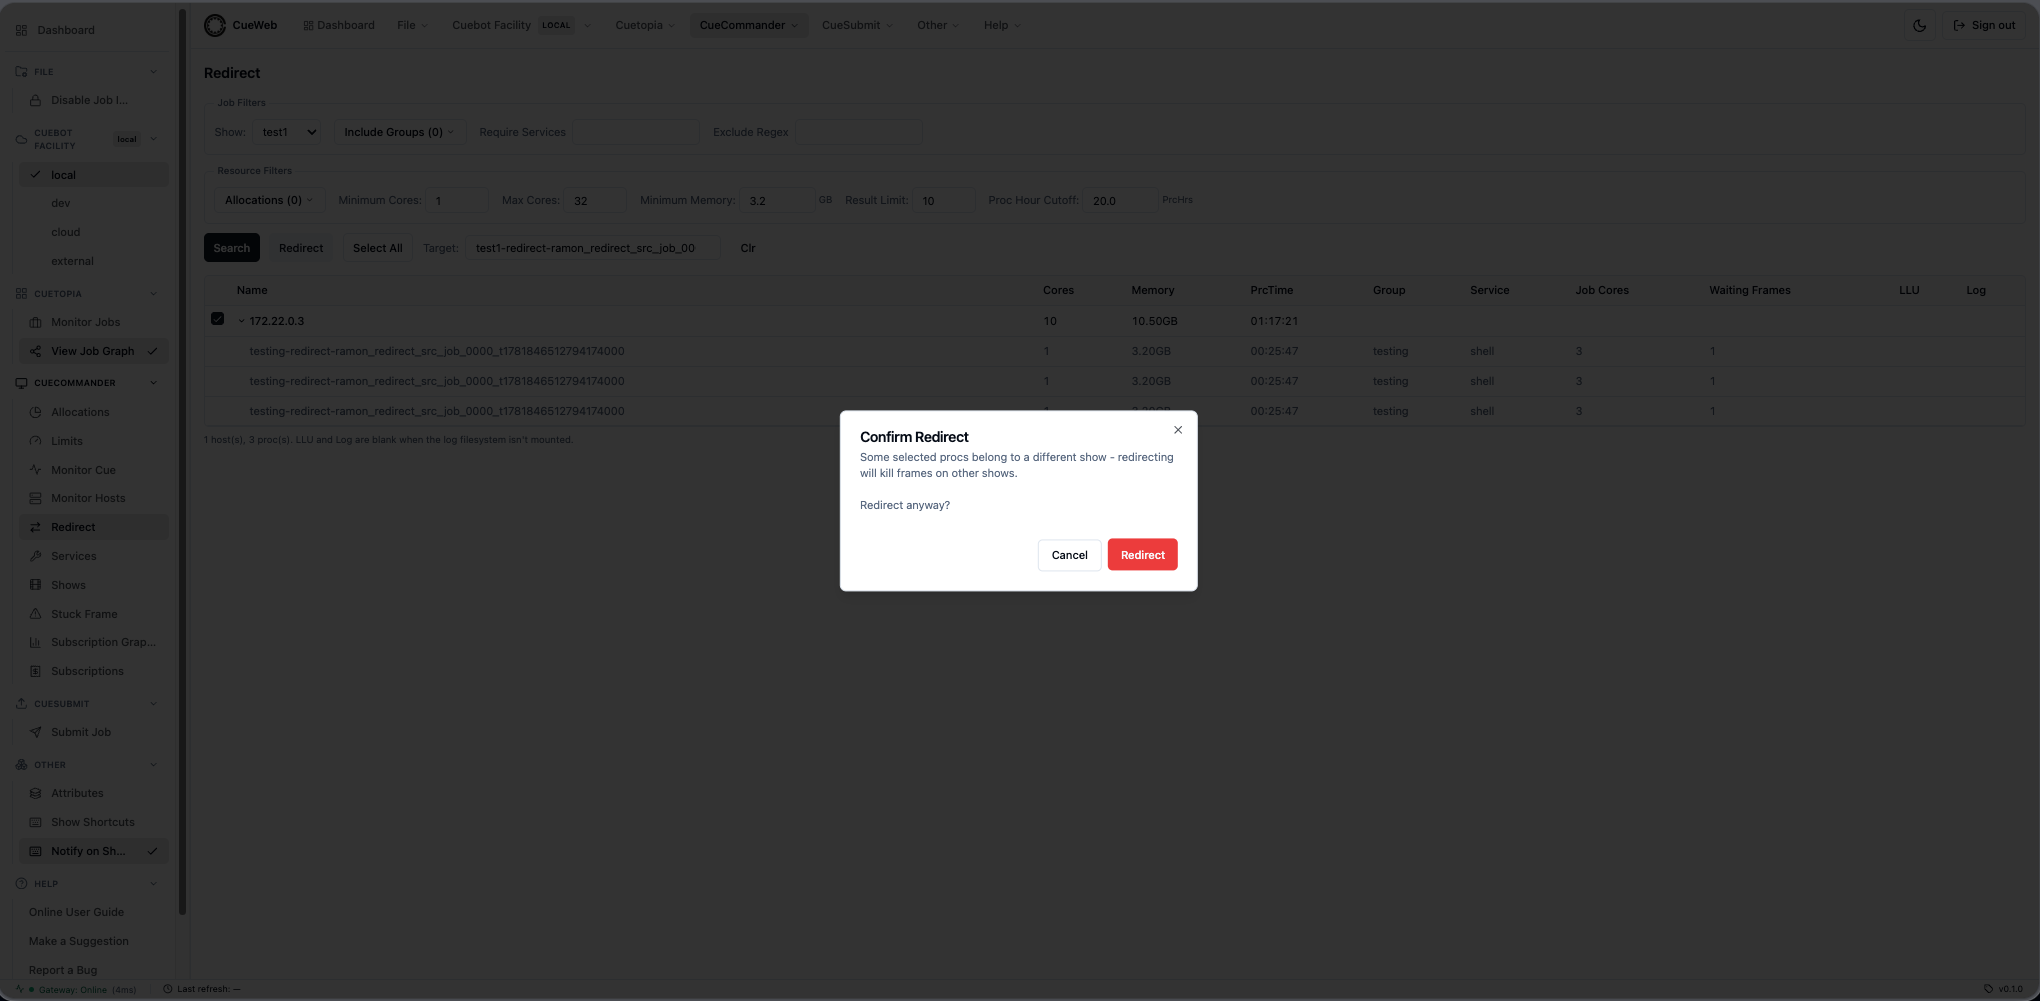
-
A success toast confirms how many hosts were redirected.
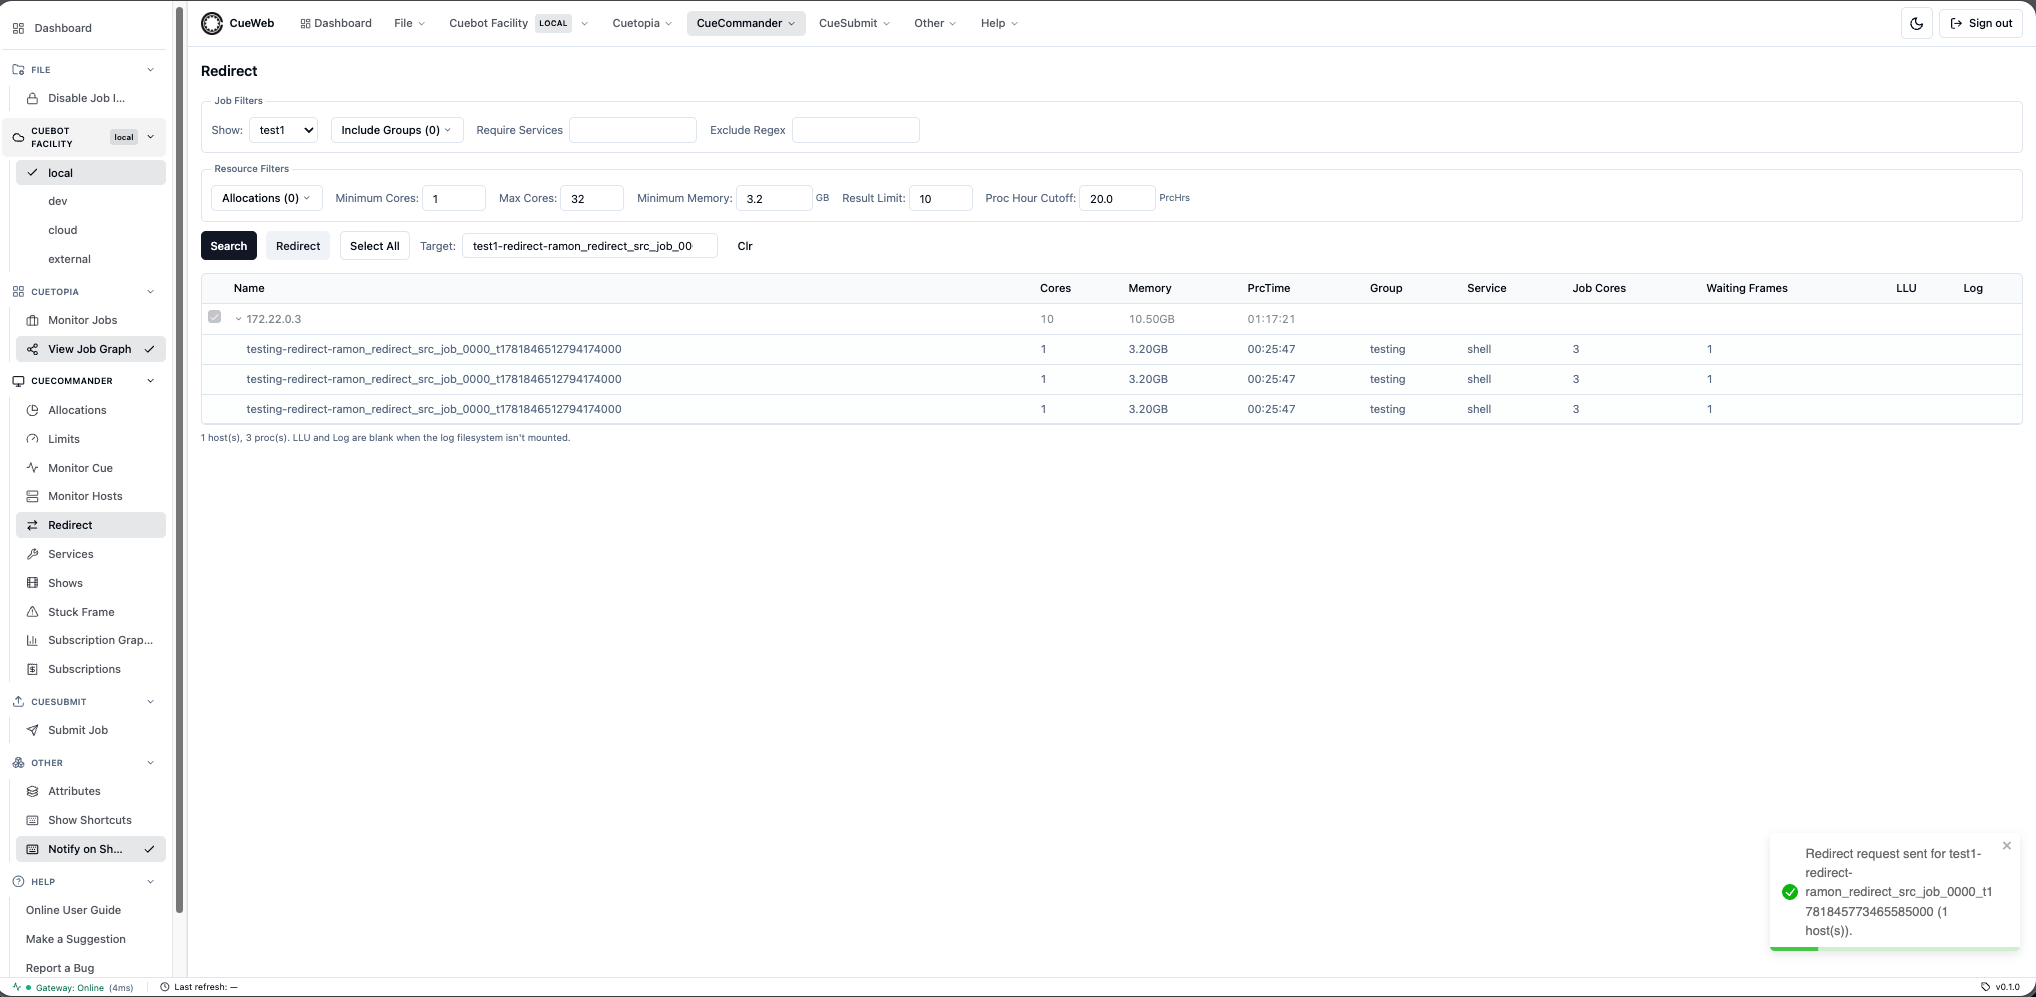
Use Clr to reset the form and start a new search.
Monitoring the cue (Monitor Cue)
The Monitor Cue page (CueCommander → Monitor Cue) shows every job for the shows you choose, grouped under their show and groups - the CueWeb version of CueGUI’s Monitor Cue window.
- Open CueCommander → Monitor Cue. The table is empty until you pick shows.
- Open the Shows menu and select one or more shows (or All Shows). The job tree loads, grouped by show and group. Use Expand All / Collapse All to open or fold the tree.
- Read the CueGUI-parity columns - Run / Cores / Gpus / Wait / Depend / Total, the Booking bar (running/waiting with cyan min-core and red max-core markers), Min/Max cores and GPUs, Pri, MaxRss, Age, and Progress. Click a header to sort; use the Columns dropdown to show/hide and reorder, and Filter jobs… to narrow the rows. Row colors flag state at a glance (blue = paused, red = dead, green = waiting, purple = all-depend).
- Select jobs - tick checkboxes, Shift+click a range, or type a name/regex in the Select: box to select matches live - then use the toolbar’s Eat / Retry / Pause / Unpause / Kill (Kill confirms first). Auto-refresh keeps the view current every 5 seconds.
- Right-click a job for the full menu, including Send To Group… (move the job into another group of its show) and the resource/priority setters (Set Min/Max Cores, Set Min/Max GPUs, Set Priority).
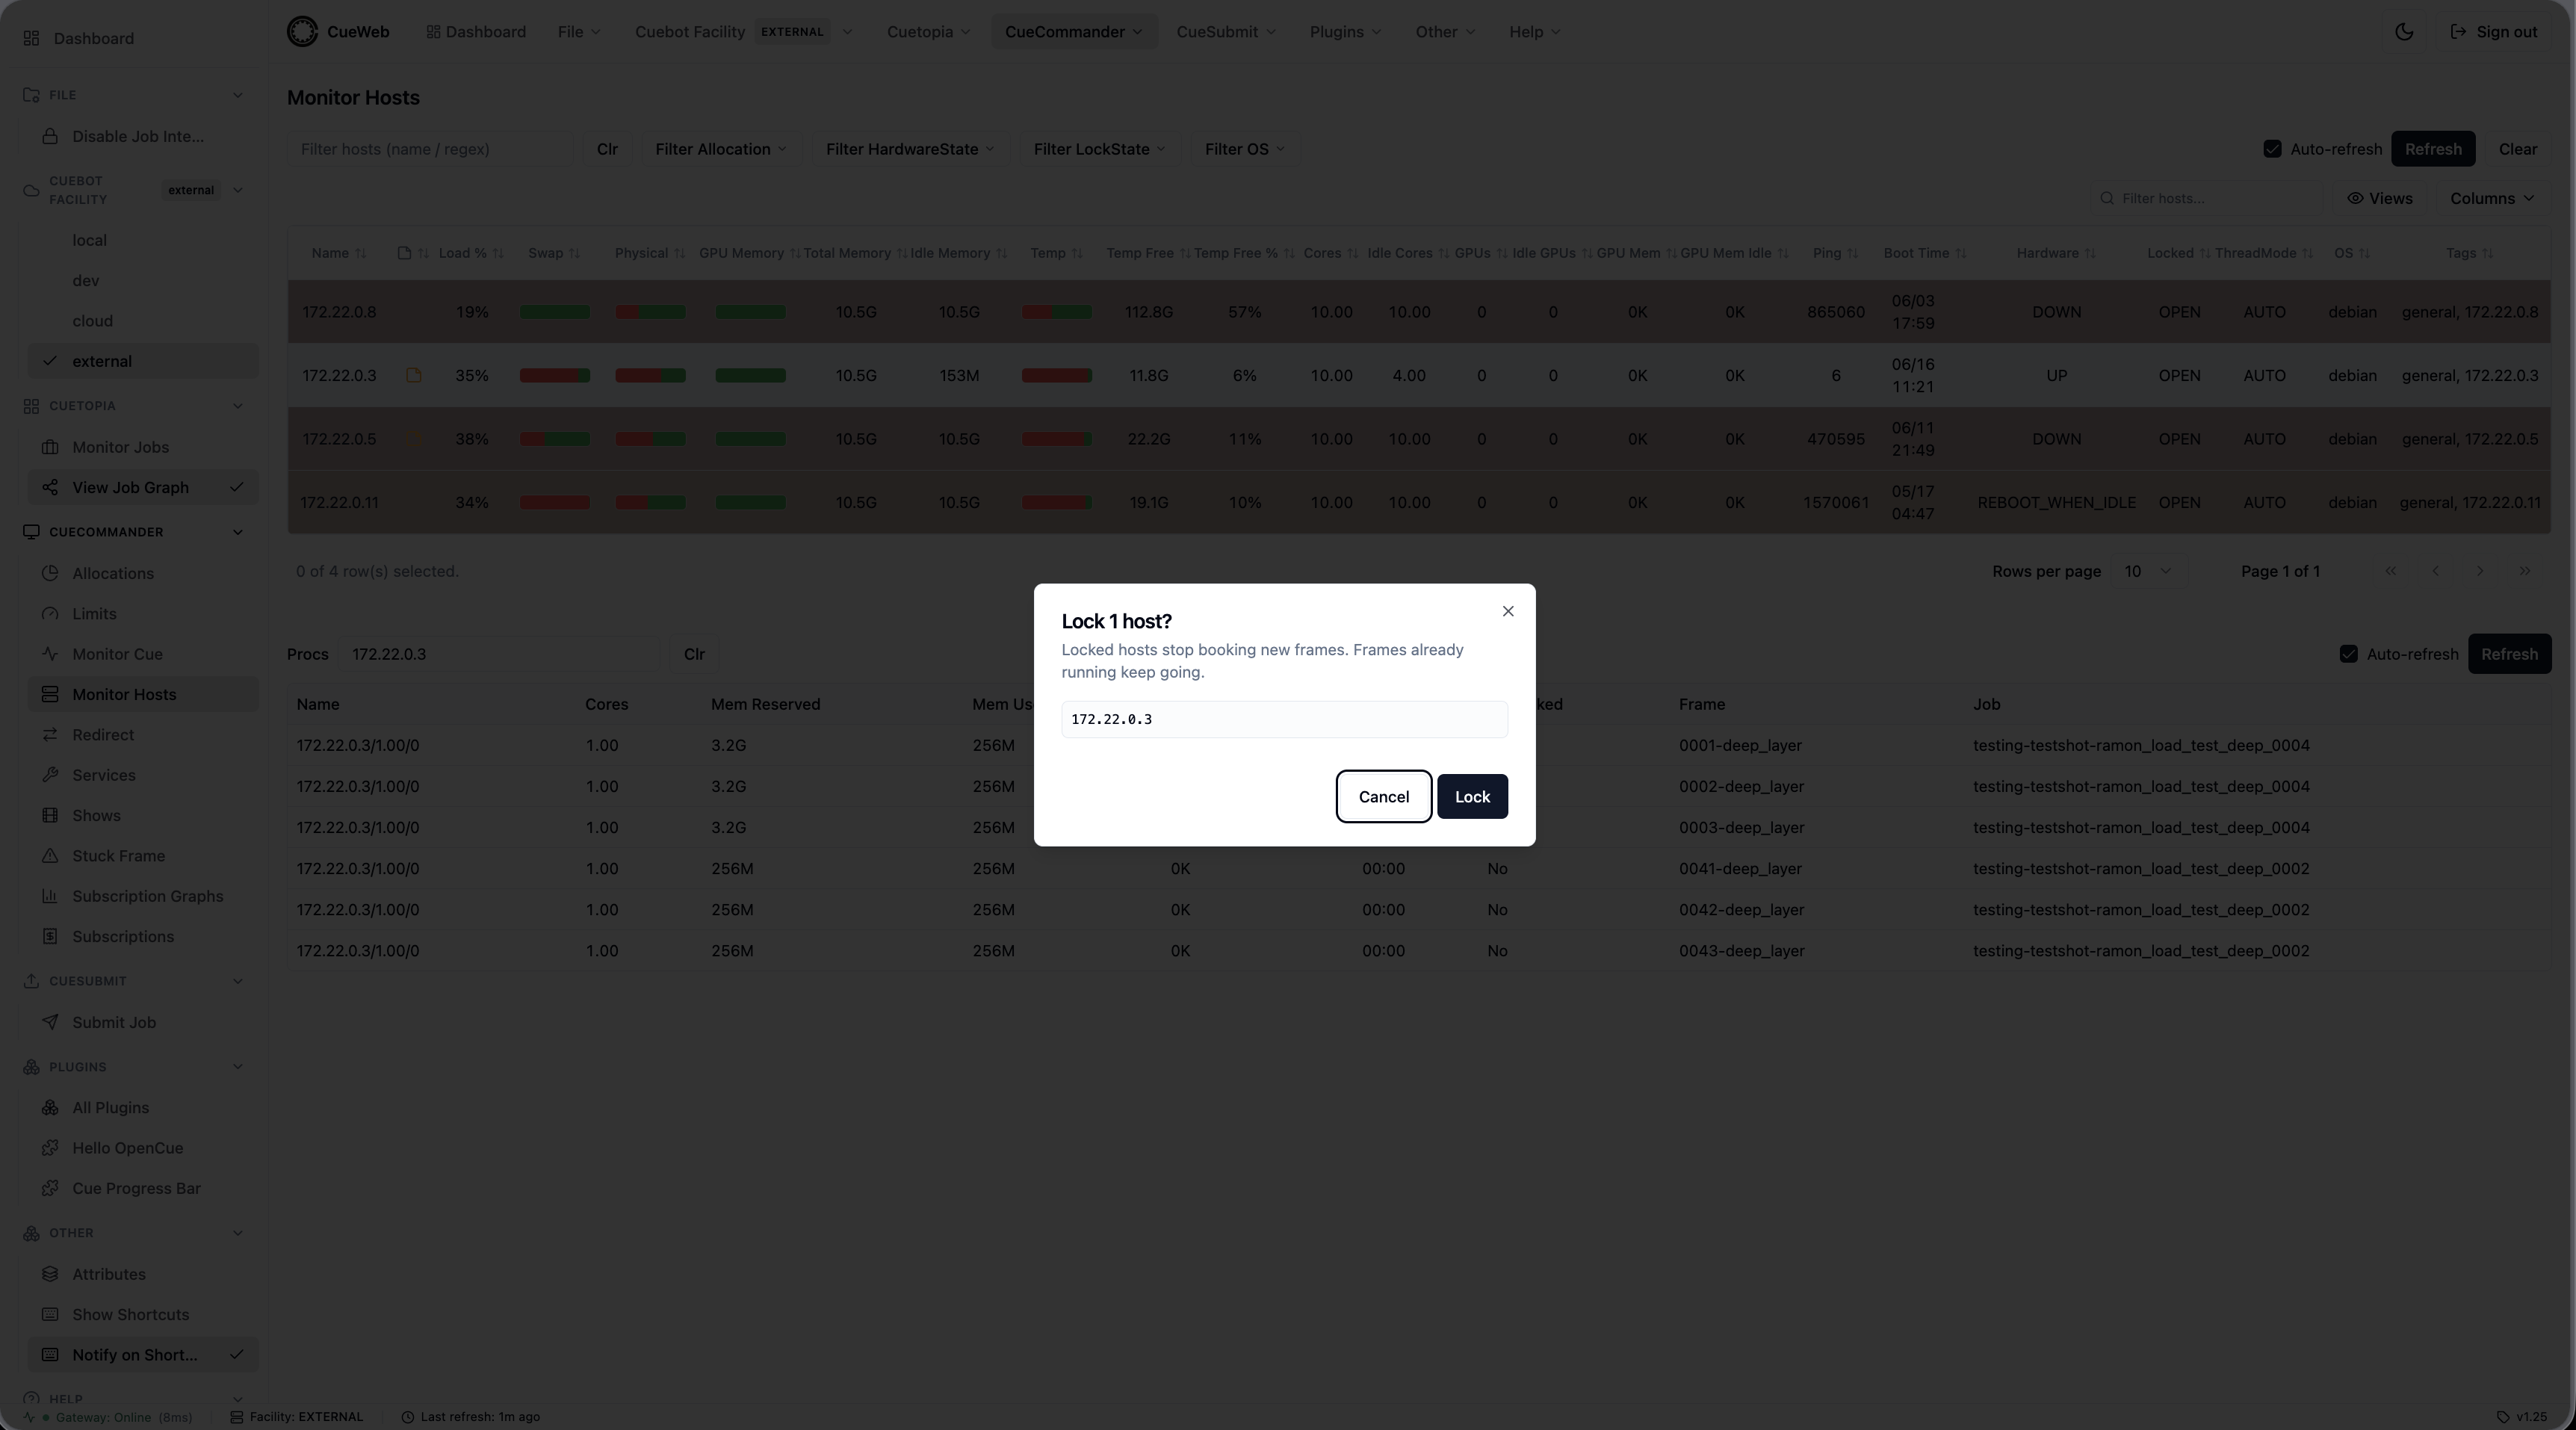
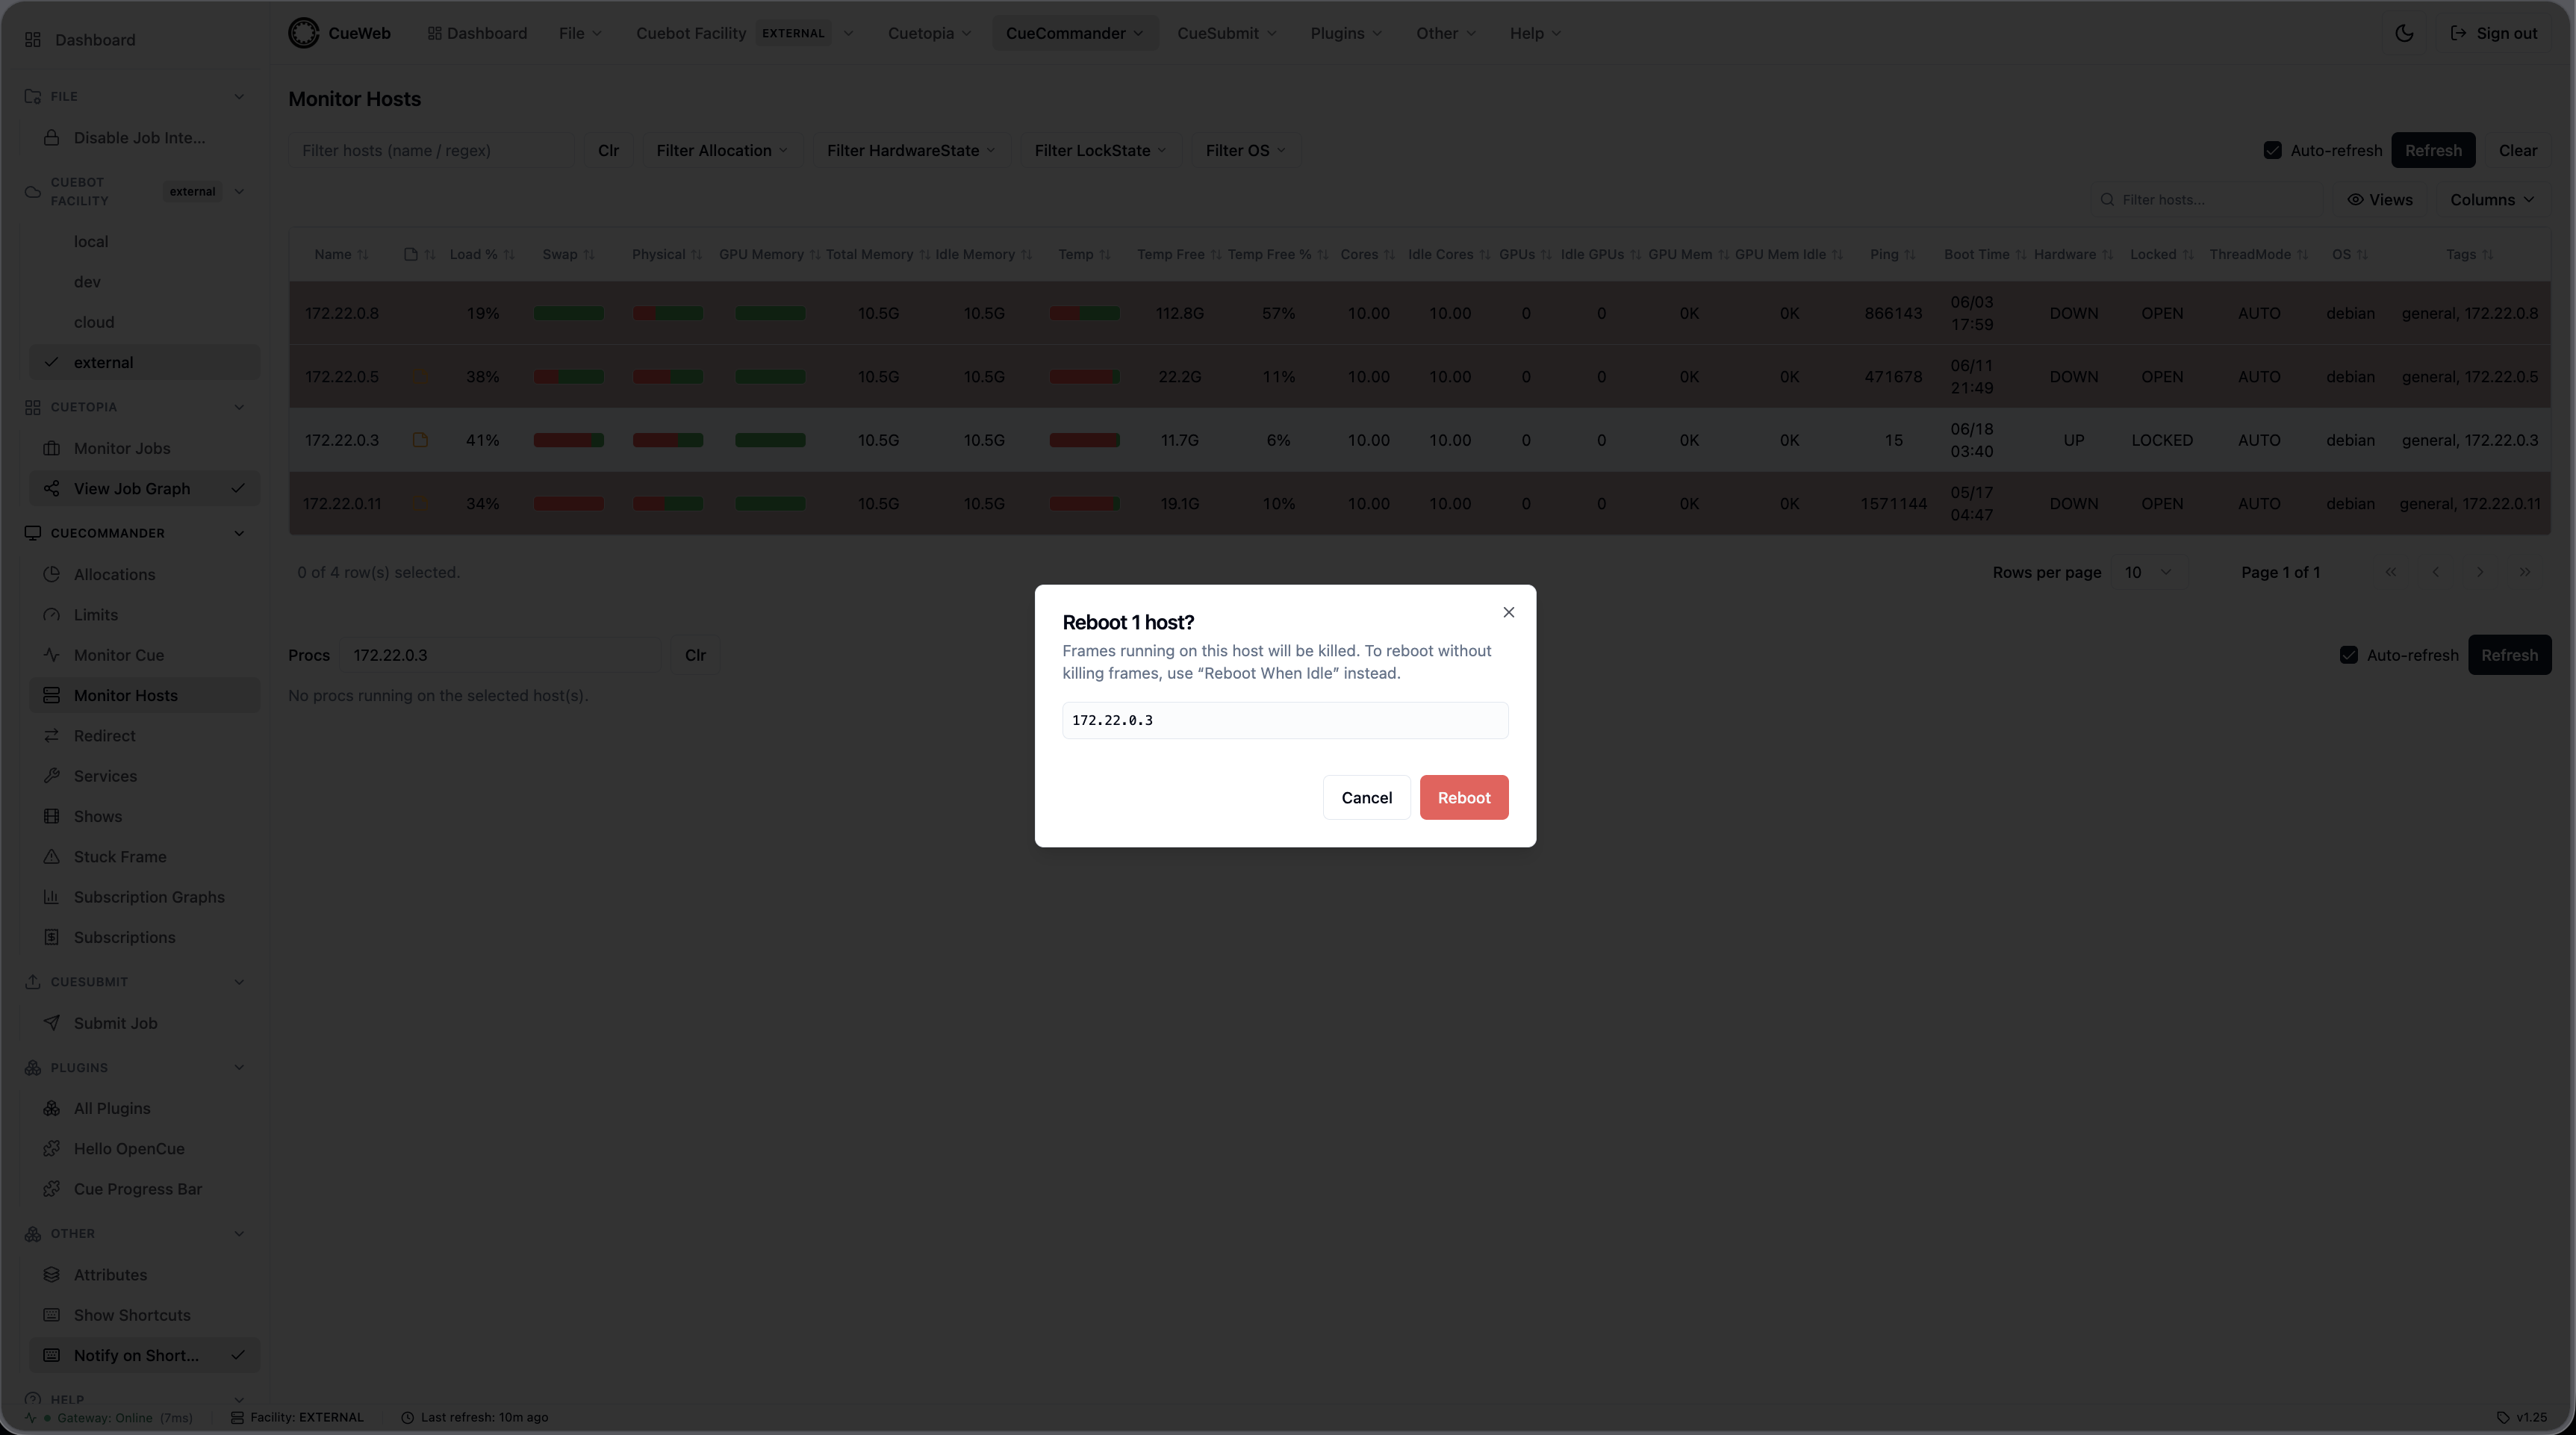
Managing render hosts (Monitor Hosts)
The Monitor Hosts page (CueCommander → Monitor Hosts) is the CueWeb version of CueGUI’s Monitor Hosts window, with the full column set and host actions.
-
Open CueCommander → Monitor Hosts. The table shows every host, with Swap / Physical / GPU Memory / Temp as red/green usage bars and rows tinted by condition (red = a non-
UPhost, amber = waiting to reboot when idle, yellow =UPbut locked).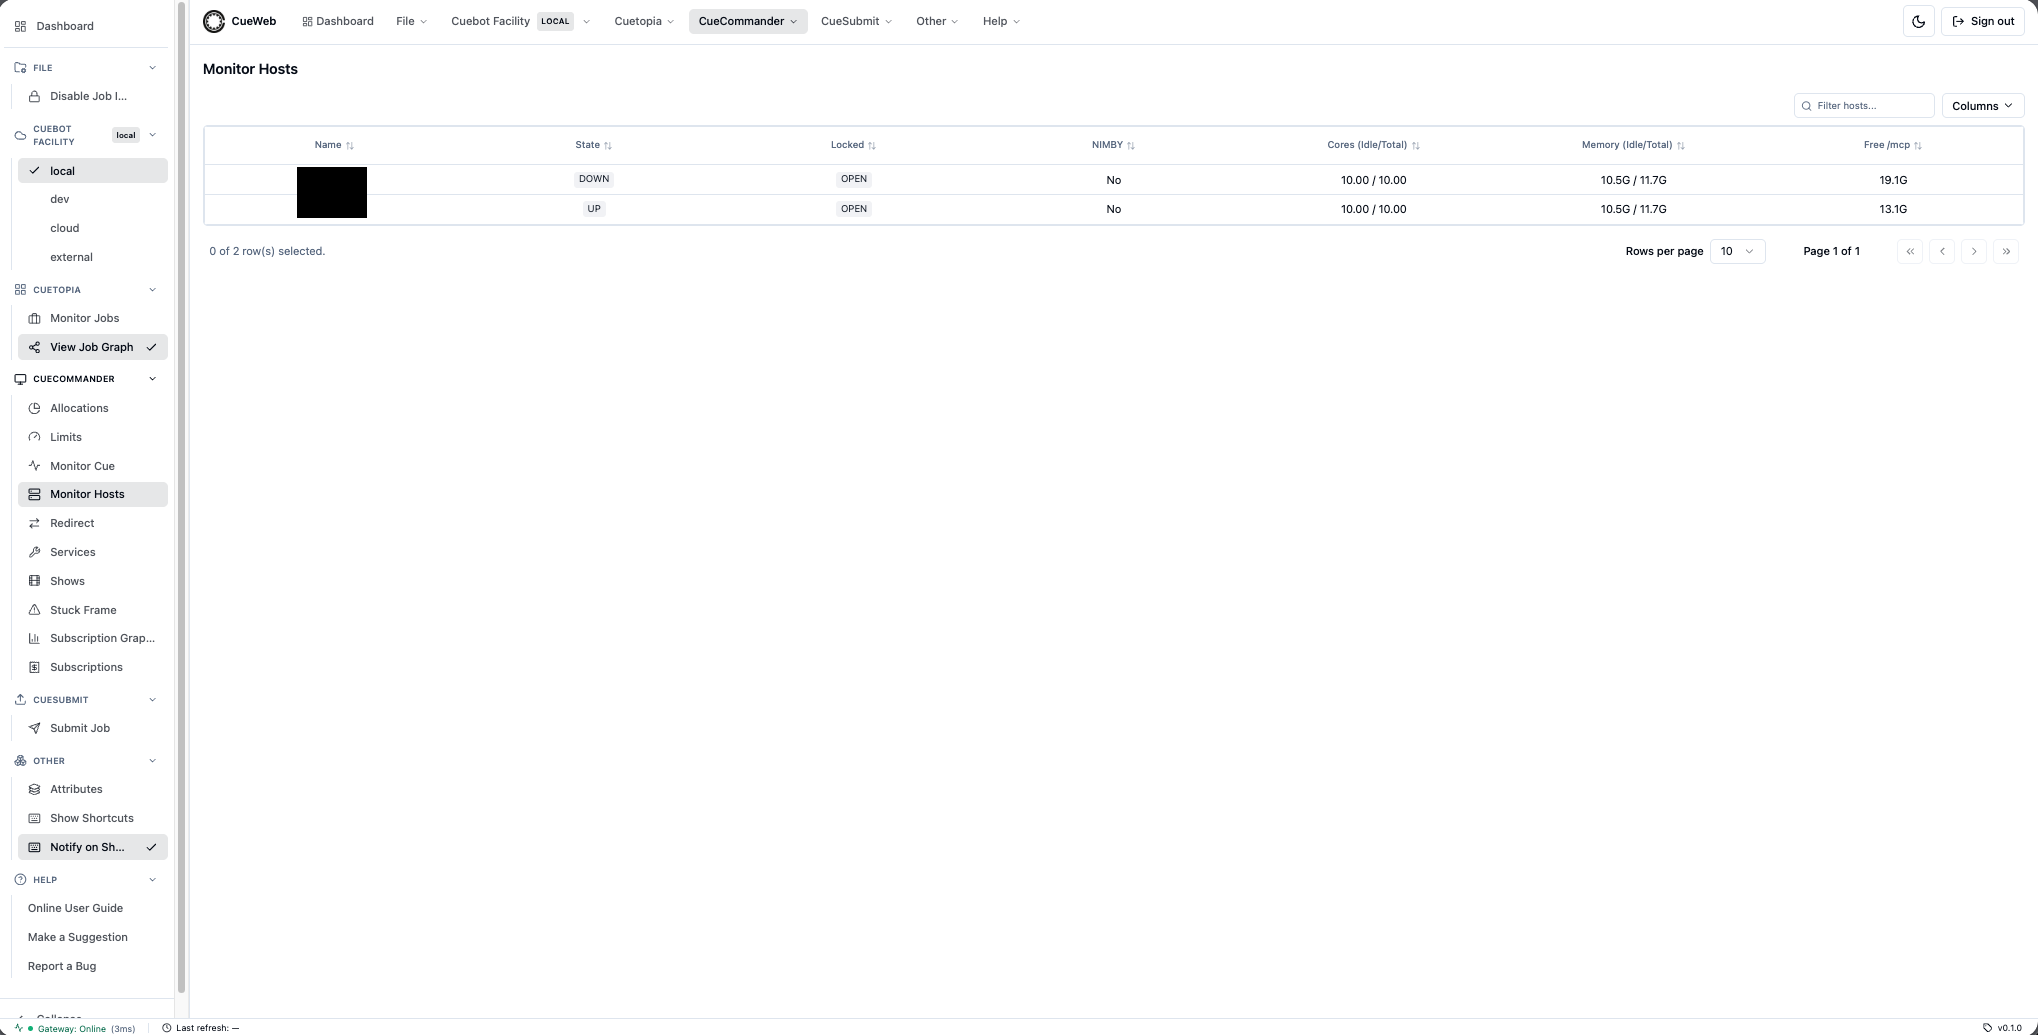
-
Narrow the list with the filter bar: type a name or regex, or use the Filter Allocation / HardwareState / LockState / OS dropdowns. The active filters appear in the URL, so you can bookmark or share a filtered view.
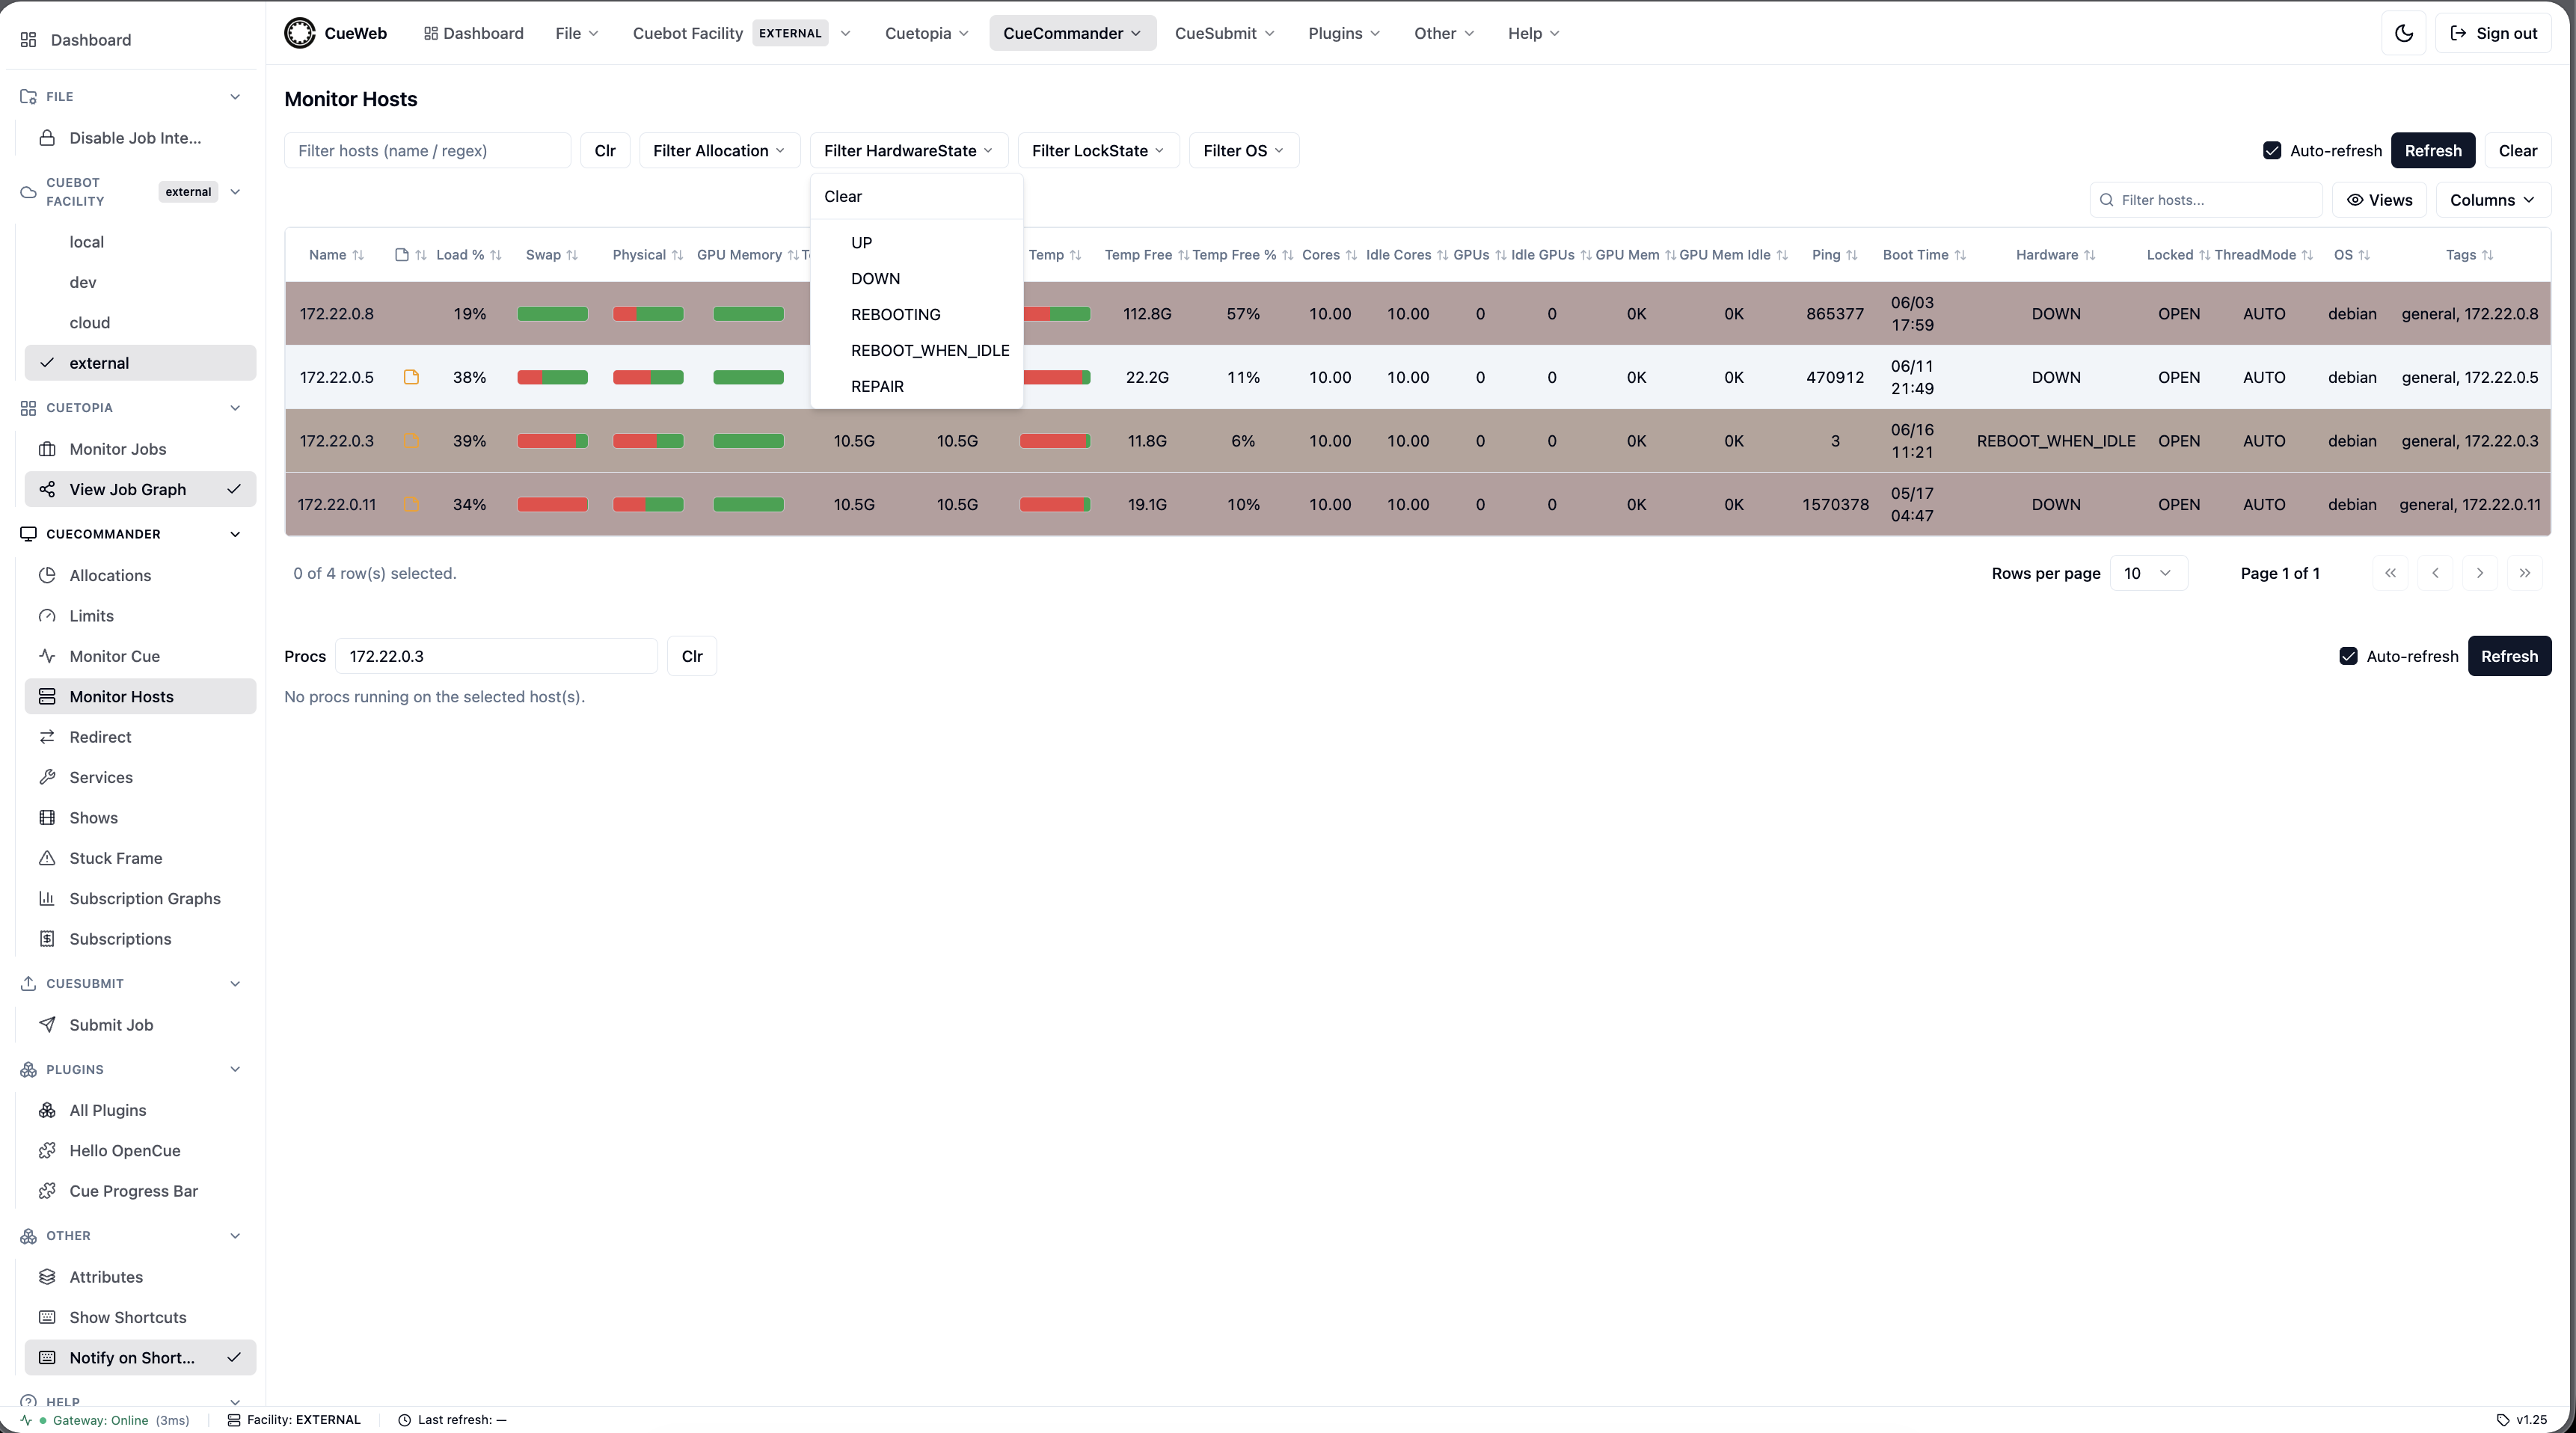
-
Right-click a host for its actions.
-
Lock Host takes it out of the booking pool (running frames continue); Unlock Host returns it.
-
Reboot confirms first because it kills running frames; Reboot when idle waits for frames to finish.
-
Take Ownership (enabled only for a
NIMBY_LOCKEDhost) claims the workstation for you after a confirmation.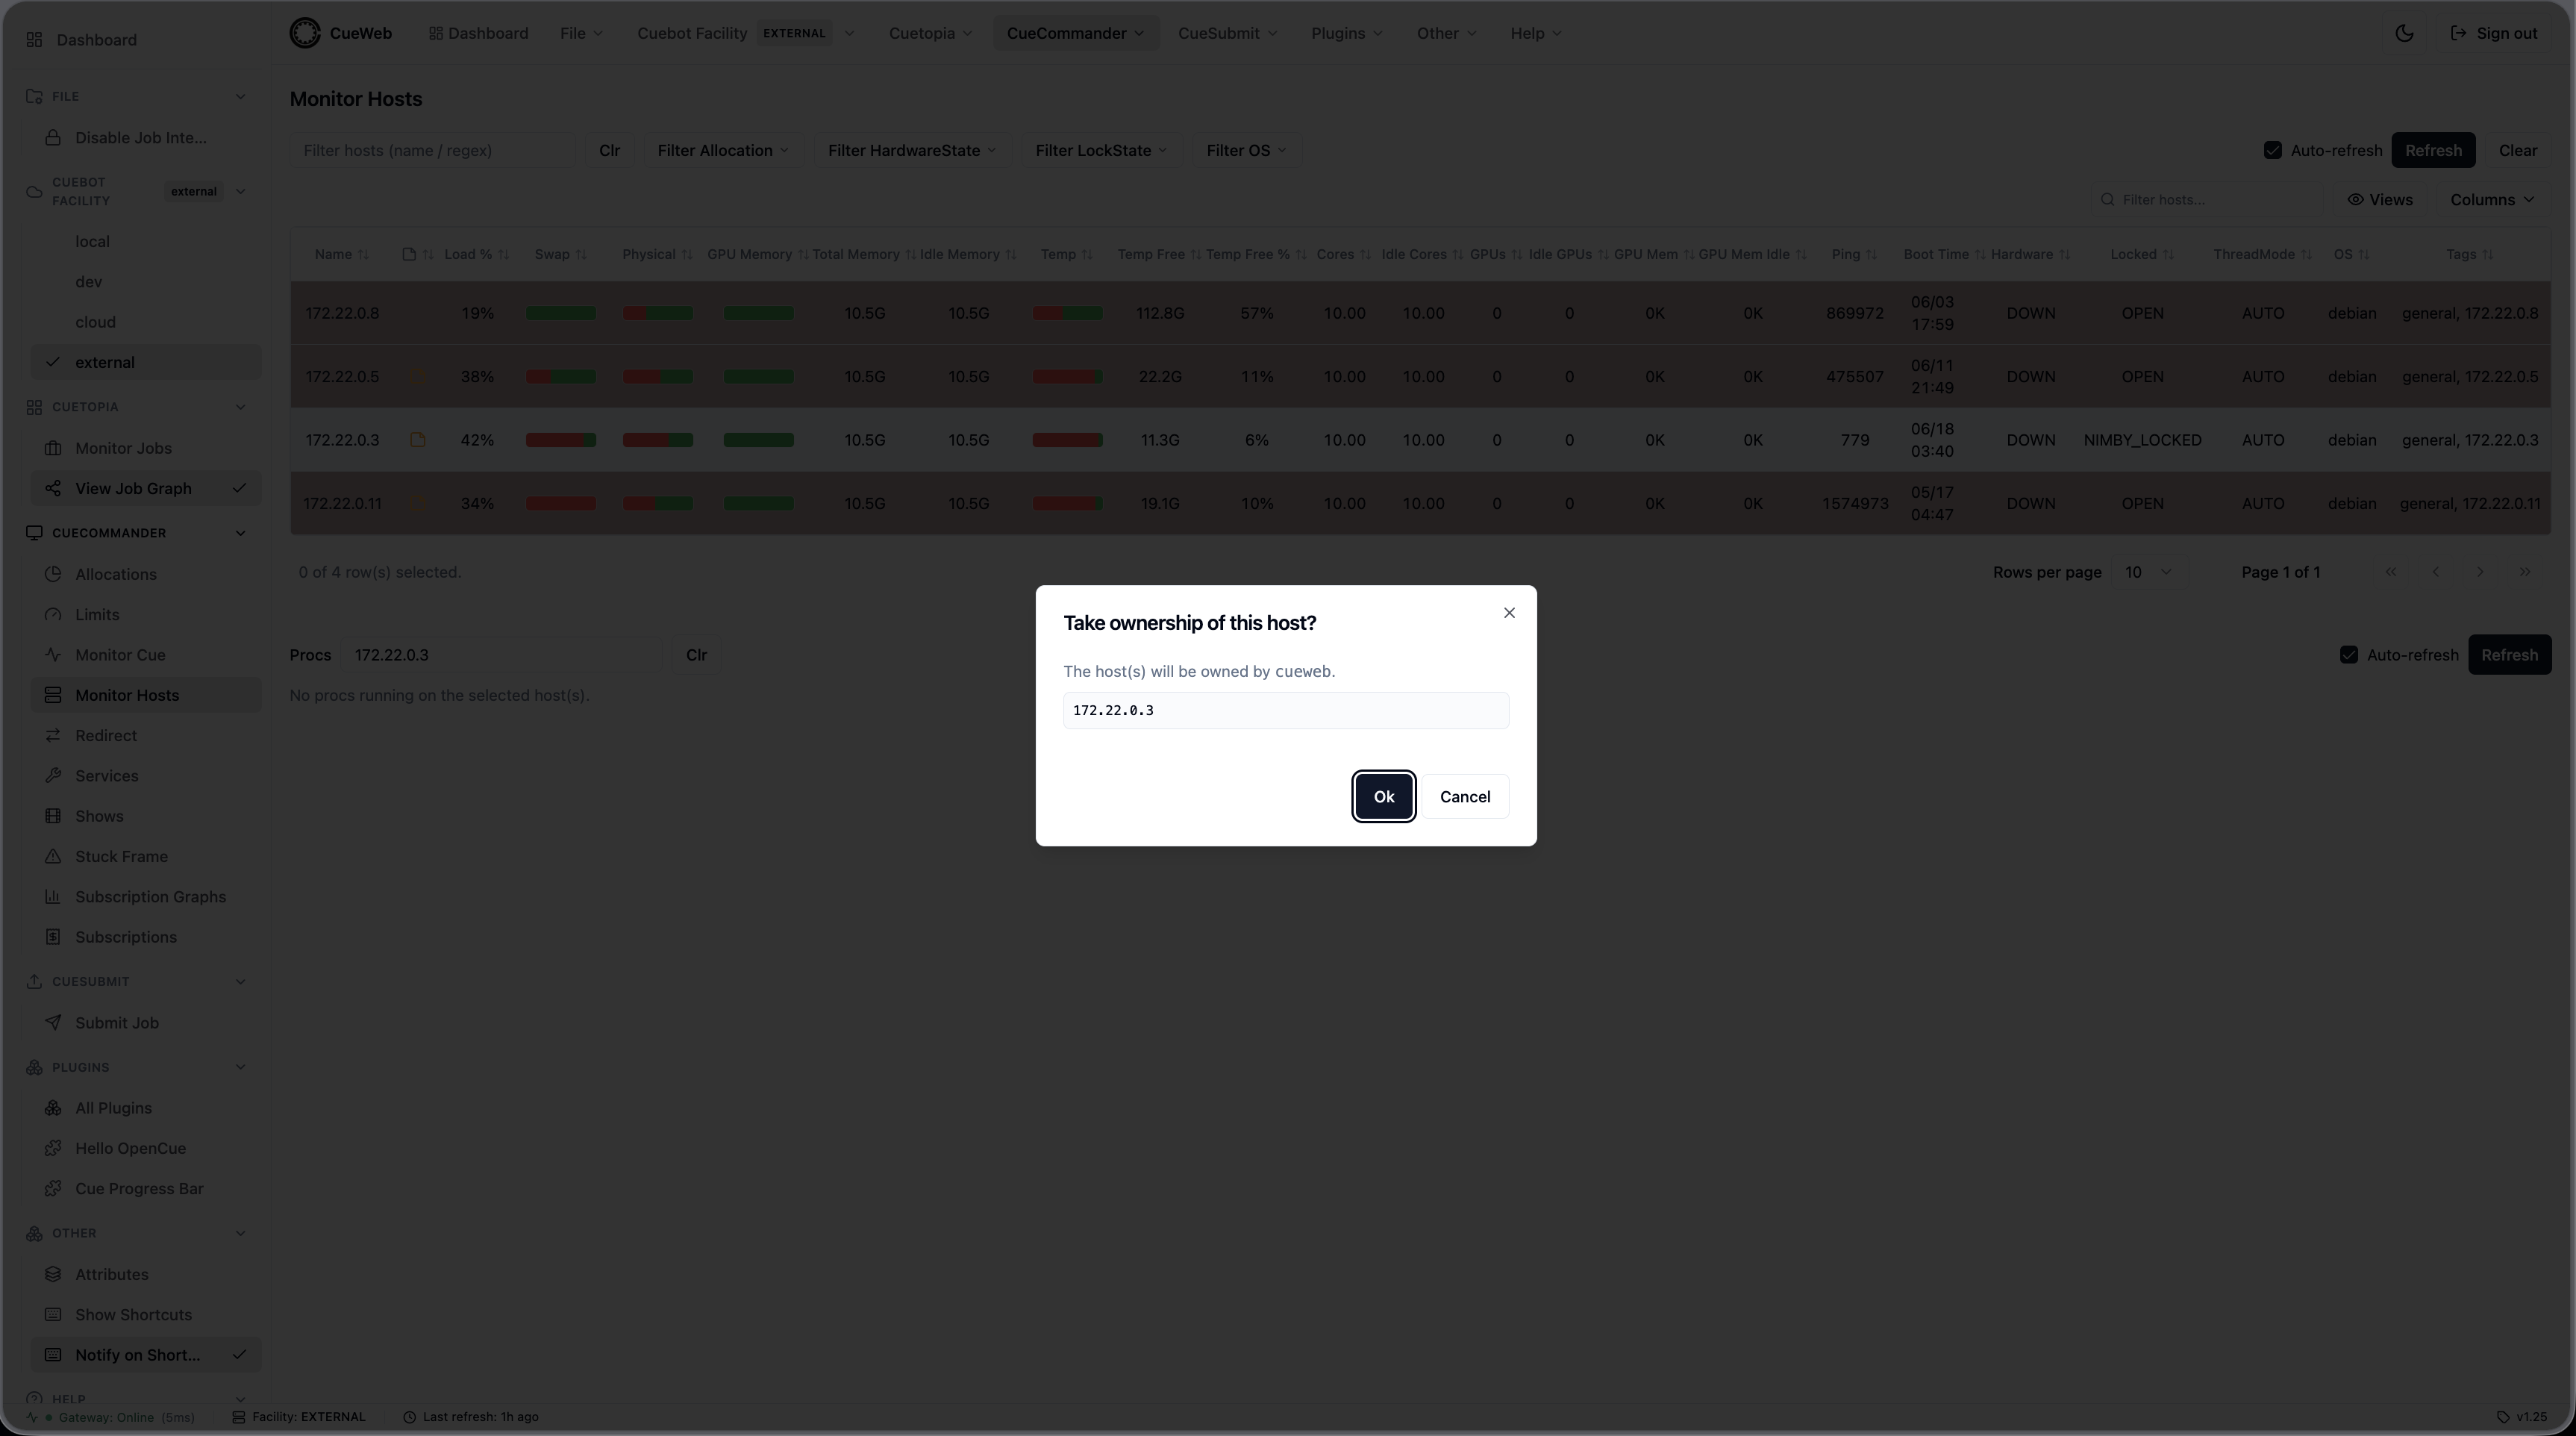
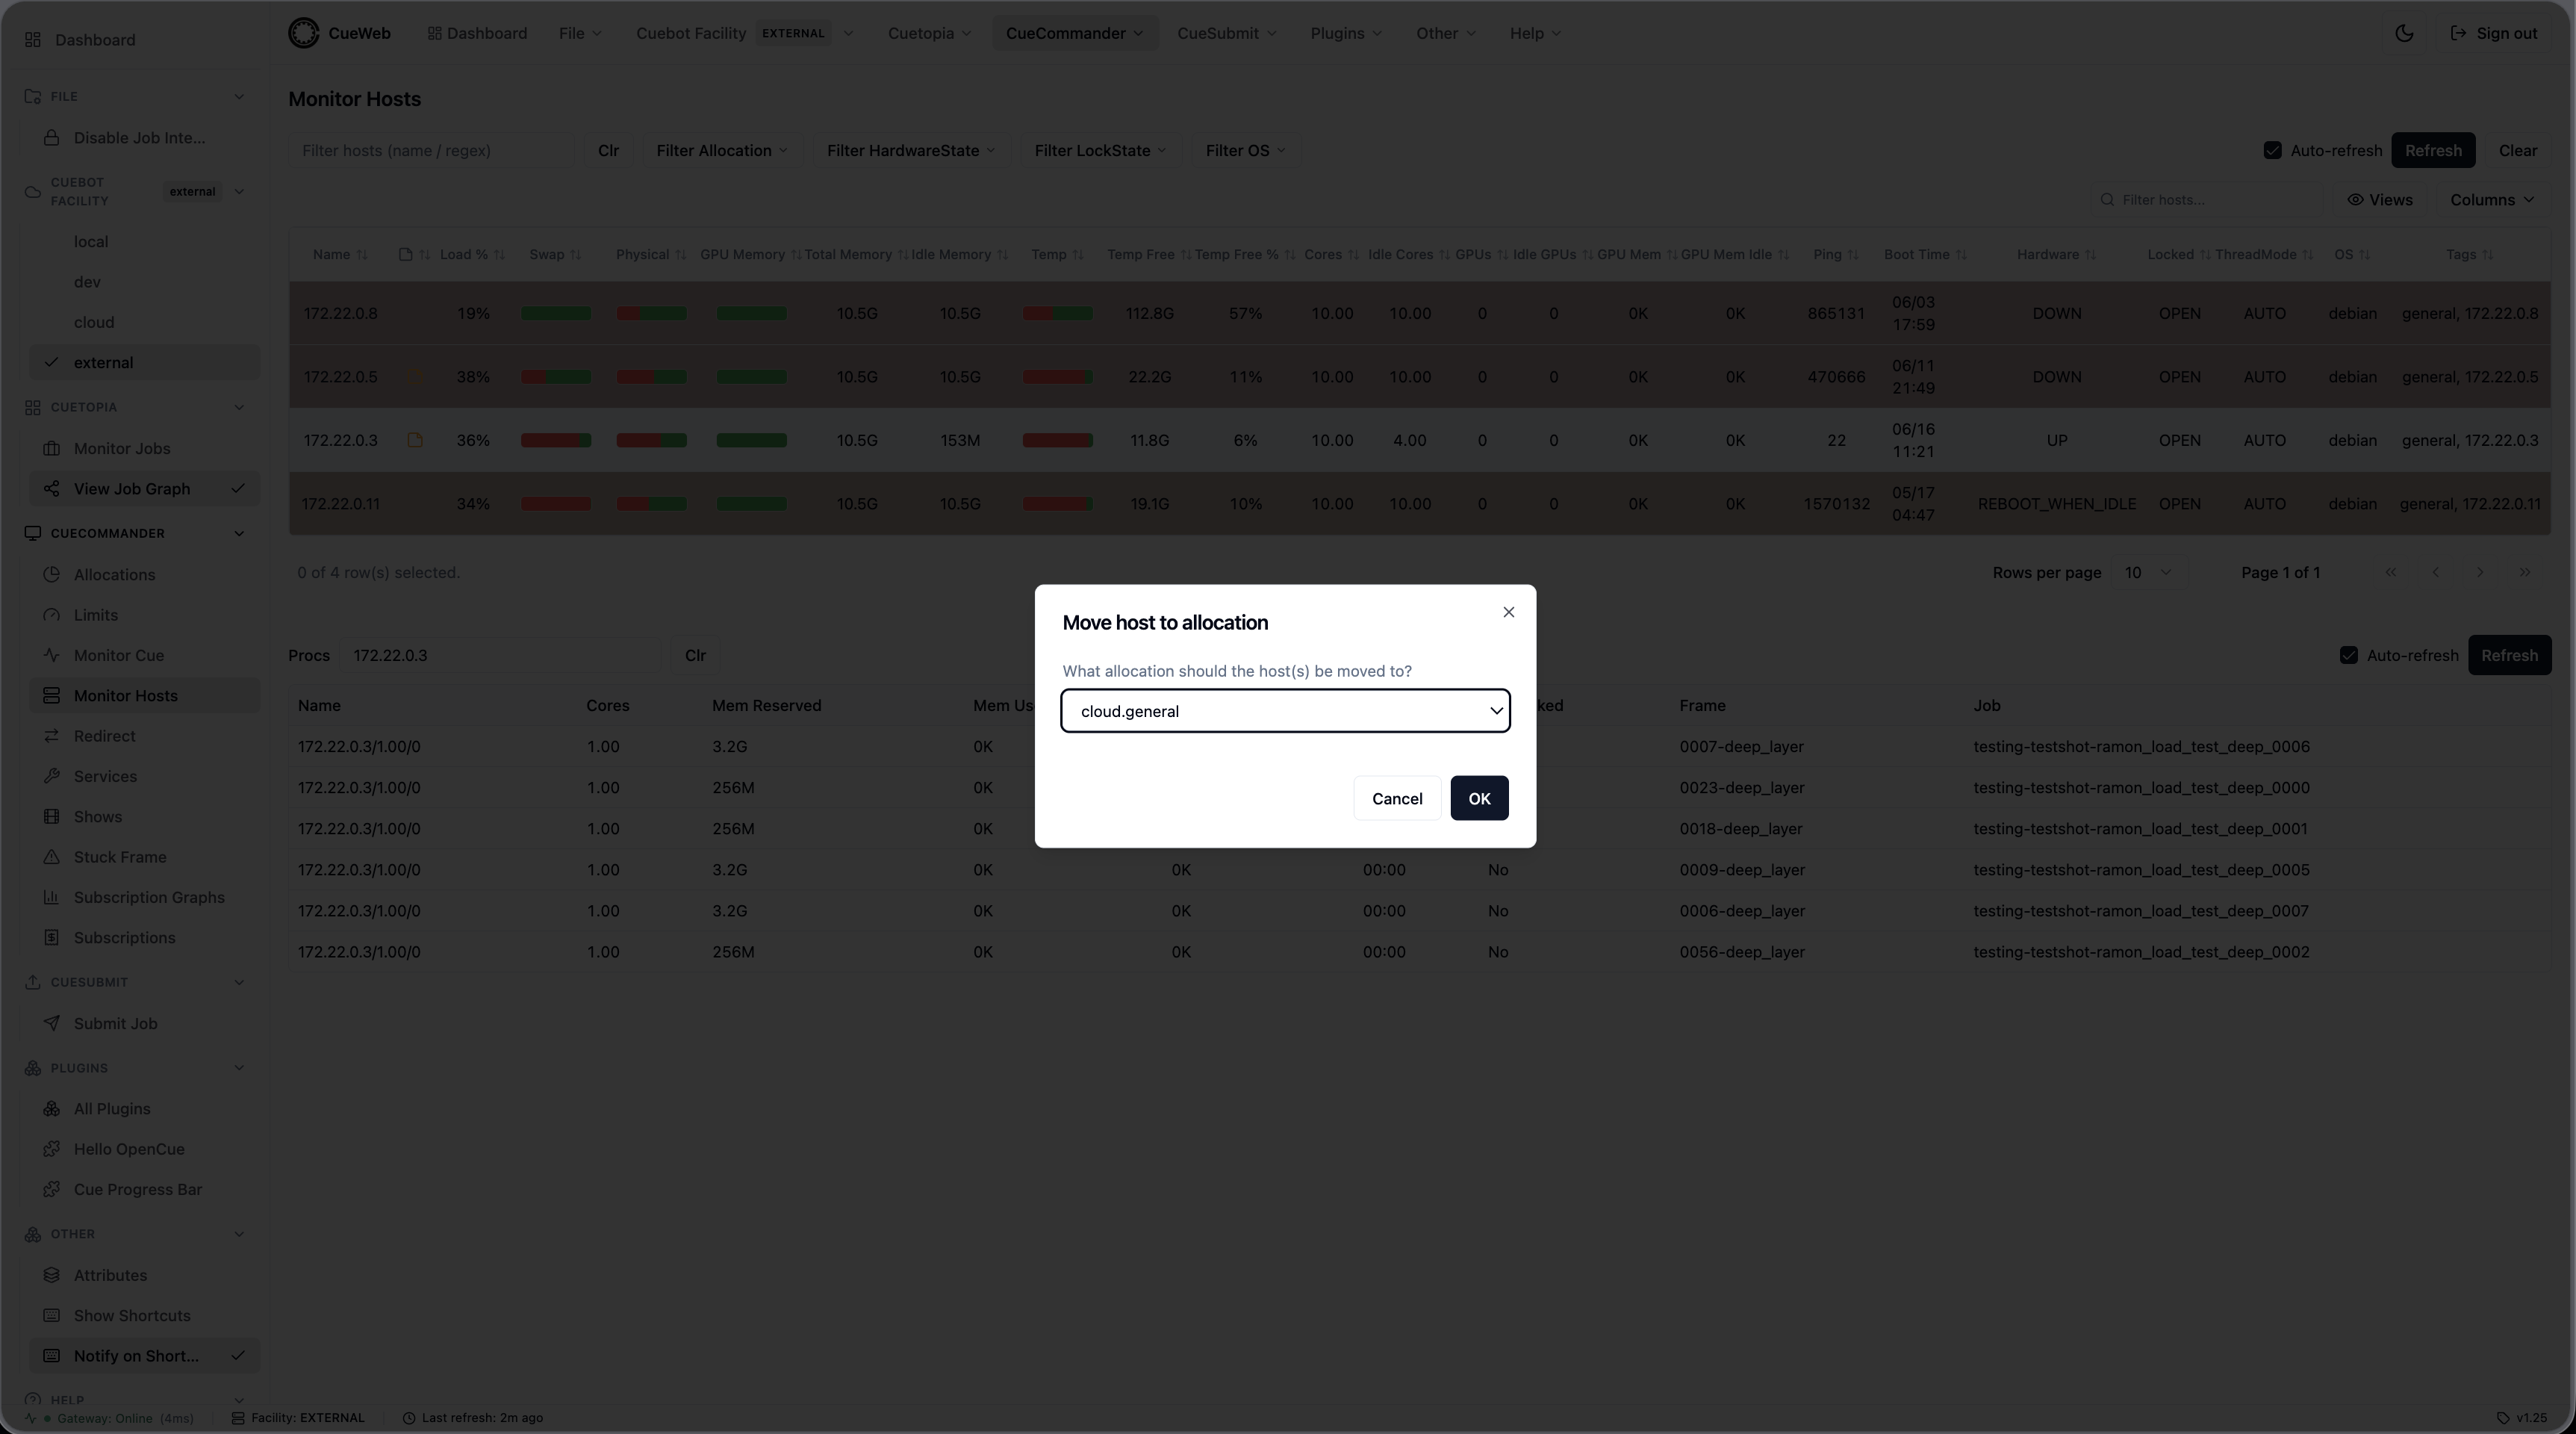
-
Edit Tags… / Rename Tag… / Change Allocation… manage the host’s tags and allocation; Set / Clear Repair State flags a host for maintenance; Delete Host removes it (with confirmation).
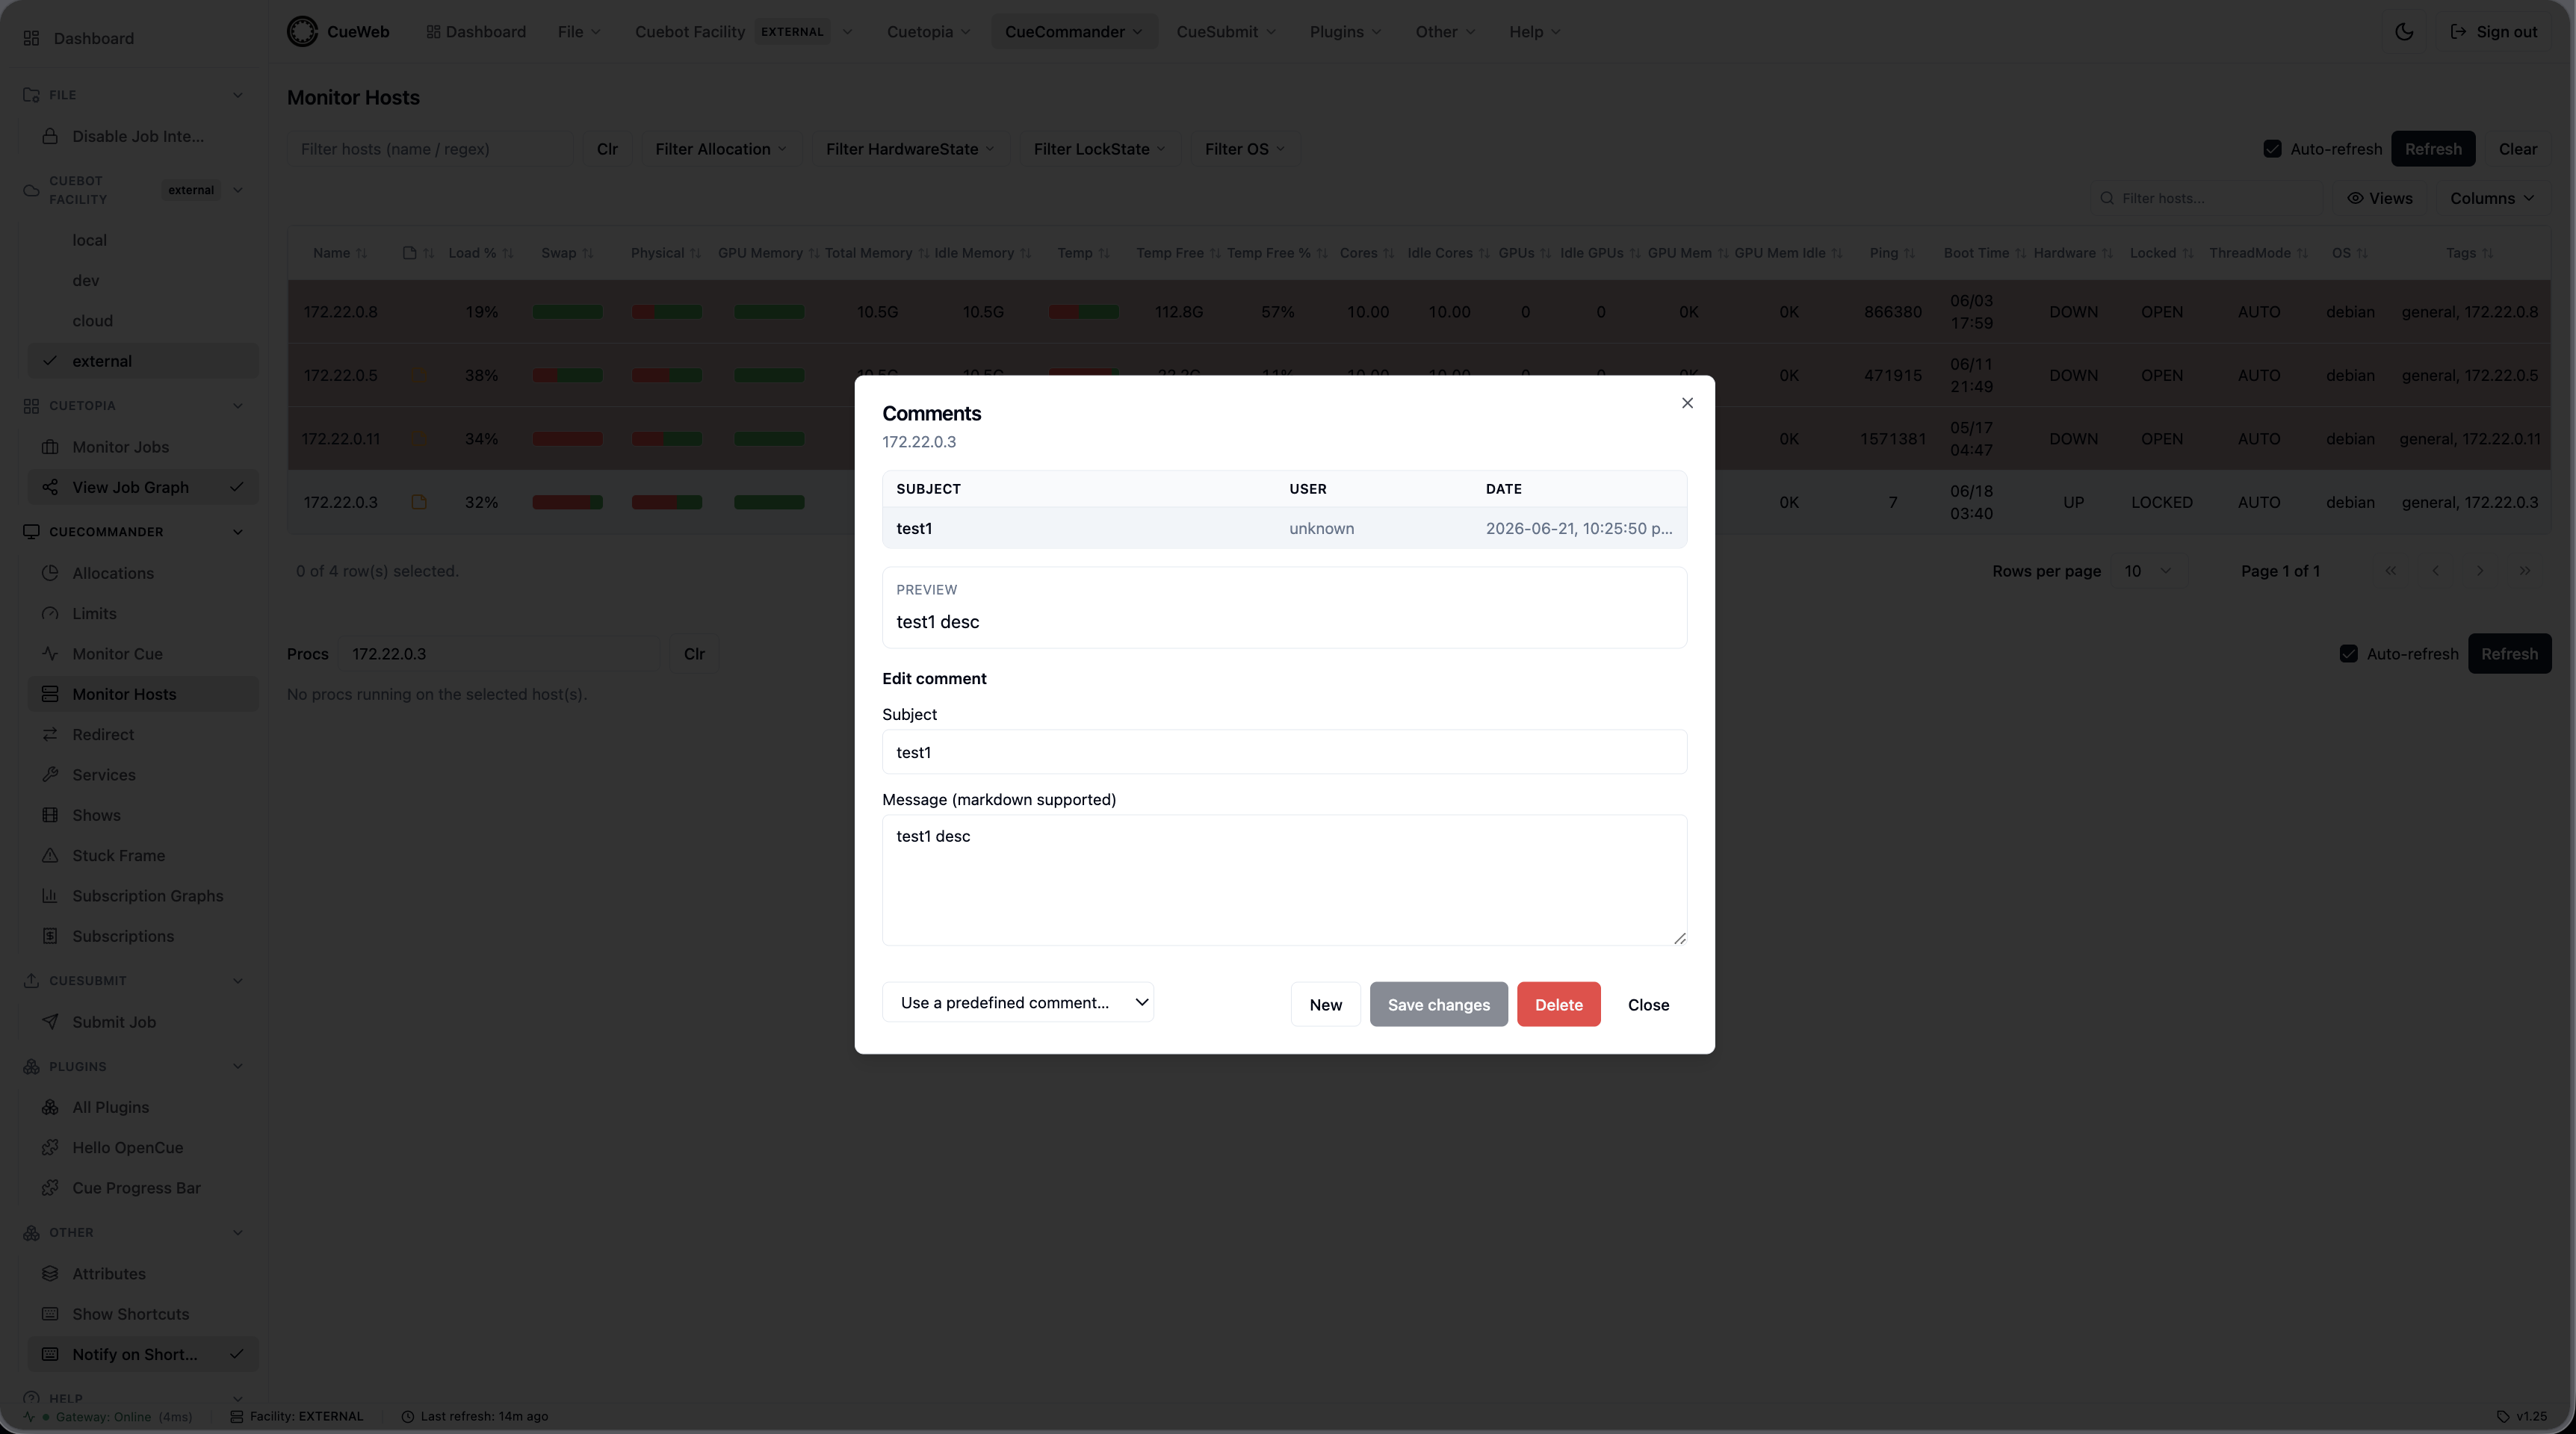
-
Comments… opens the host’s comments, including reusable predefined-comment macros.
-
-
Inspect running procs: left-click a host row (or choose View Procs from its menu, or type host names into the Procs box below the table) to load that host’s procs. Right-click a proc for View Job, Unbook, Kill, or Unbook and Kill.
Switching Cuebot facilities
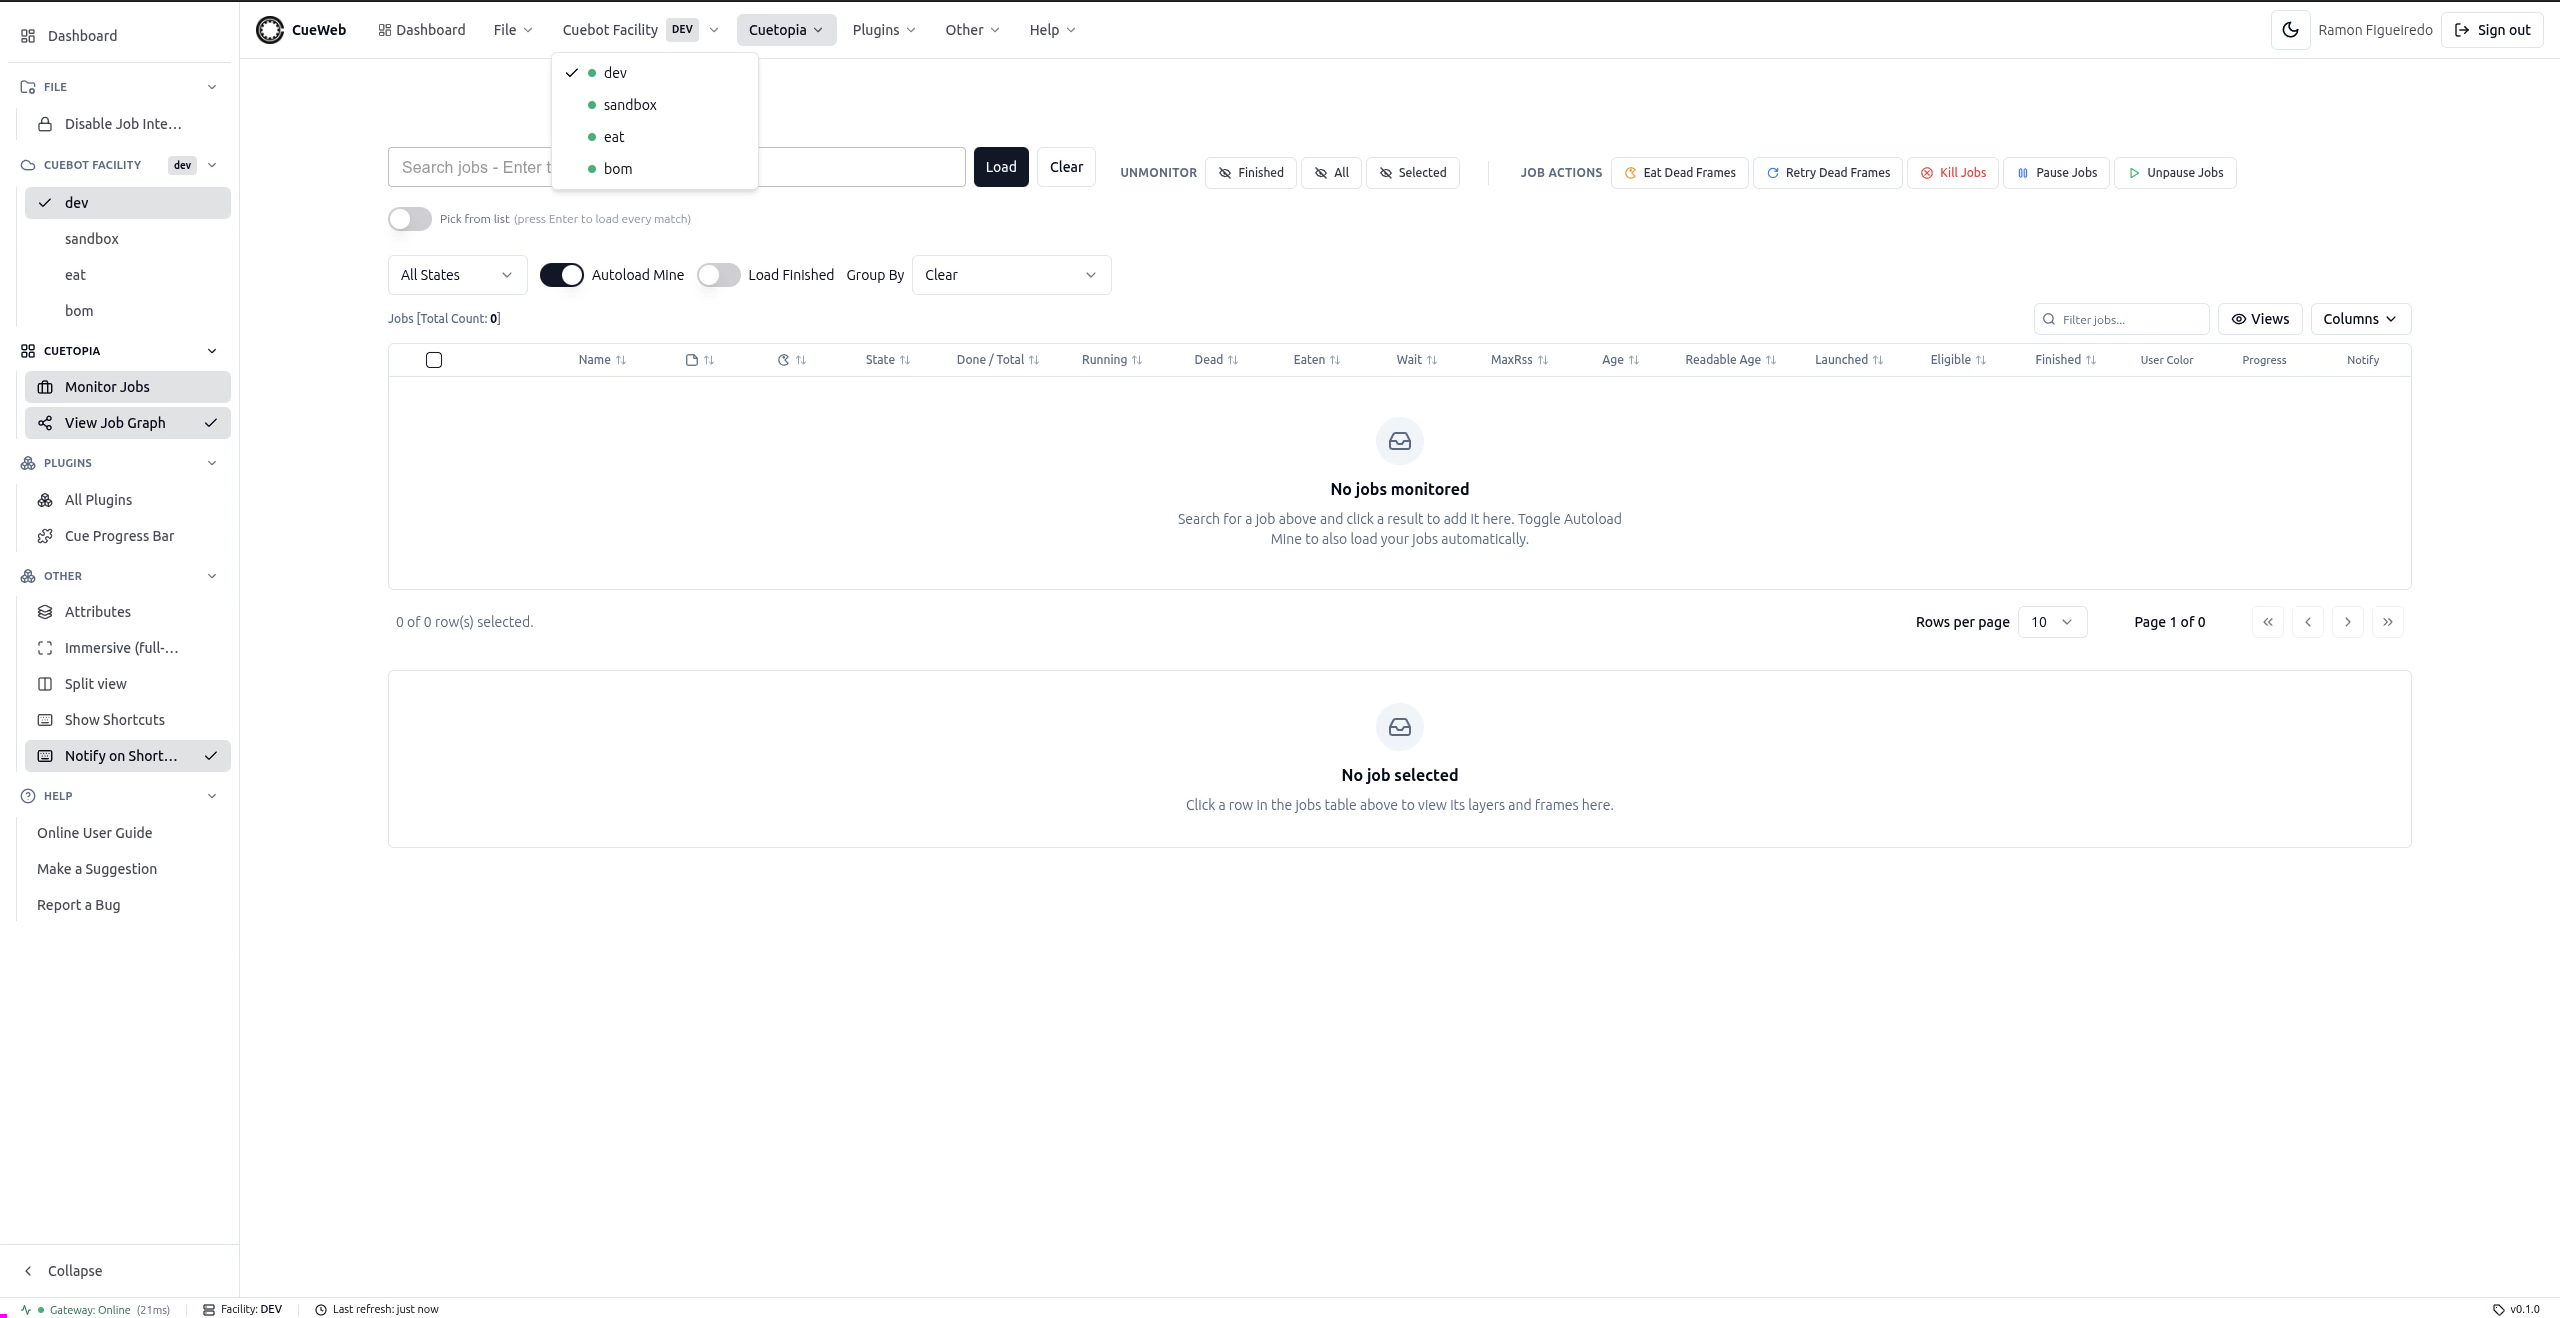
If your farm spans more than one facility - each with its own Cuebot - CueWeb lets you move between them from the Cuebot Facility menu. You always work in one facility at a time, exactly like CueGUI’s Cuebot Facility menu.
-
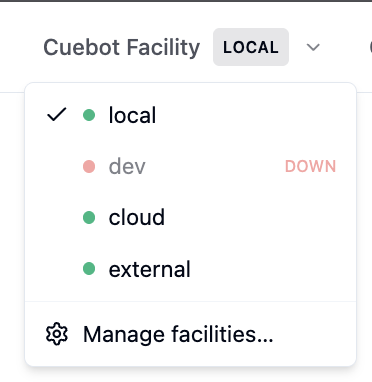
Look at the Cuebot Facility entry in the header (or the sidebar). The chip next to it shows the facility you are currently viewing.
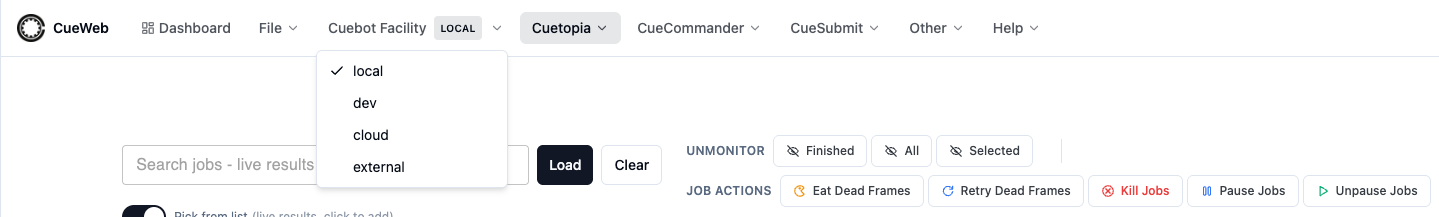
- Open the menu and pick a different facility (for example
devorcloud). Each facility has a status dot next to it: green means its gateway is reachable, red means it is down (CueWeb re-checks every 30 seconds). A facility whose dot is red is disabled - you can’t switch into a facility CueWeb can’t reach. CueWeb re-routes to the chosen facility’s Cuebot and reloads the view you are on, so the jobs, hosts, and shows you now see belong to the facility you chose. - Confirm the switch: the chip on the menu and the facility shown in the bottom status bar update to the new facility. Your choice is remembered for the rest of the session.
- Switch back the same way when you are done.
Setting up extra facilities (admin): the menu’s options come from NEXT_PUBLIC_CUEBOT_FACILITIES. To make a facility actually reach a different Cuebot, an administrator sets the server-only pair CUEBOT_<NAME>_REST_GATEWAY_URL and CUEBOT_<NAME>_JWT_SECRET for it (for example CUEBOT_DEV_REST_GATEWAY_URL / CUEBOT_DEV_JWT_SECRET). A facility with no override falls back to the default gateway, which is why the single-facility sandbox just works with local.
Re-pointing a facility at runtime (admin): you can also change a facility’s gateway URL or JWT secret without a redeploy.
-
Choose Manage facilities… from the Cuebot Facility menu.
-
On the admin screen, edit a facility’s REST gateway URL and/or JWT secret and save. The change applies immediately and is layered over the environment defaults; leaving the gateway URL blank falls back to that facility’s env value (or the default gateway). A change-history table records who changed what.
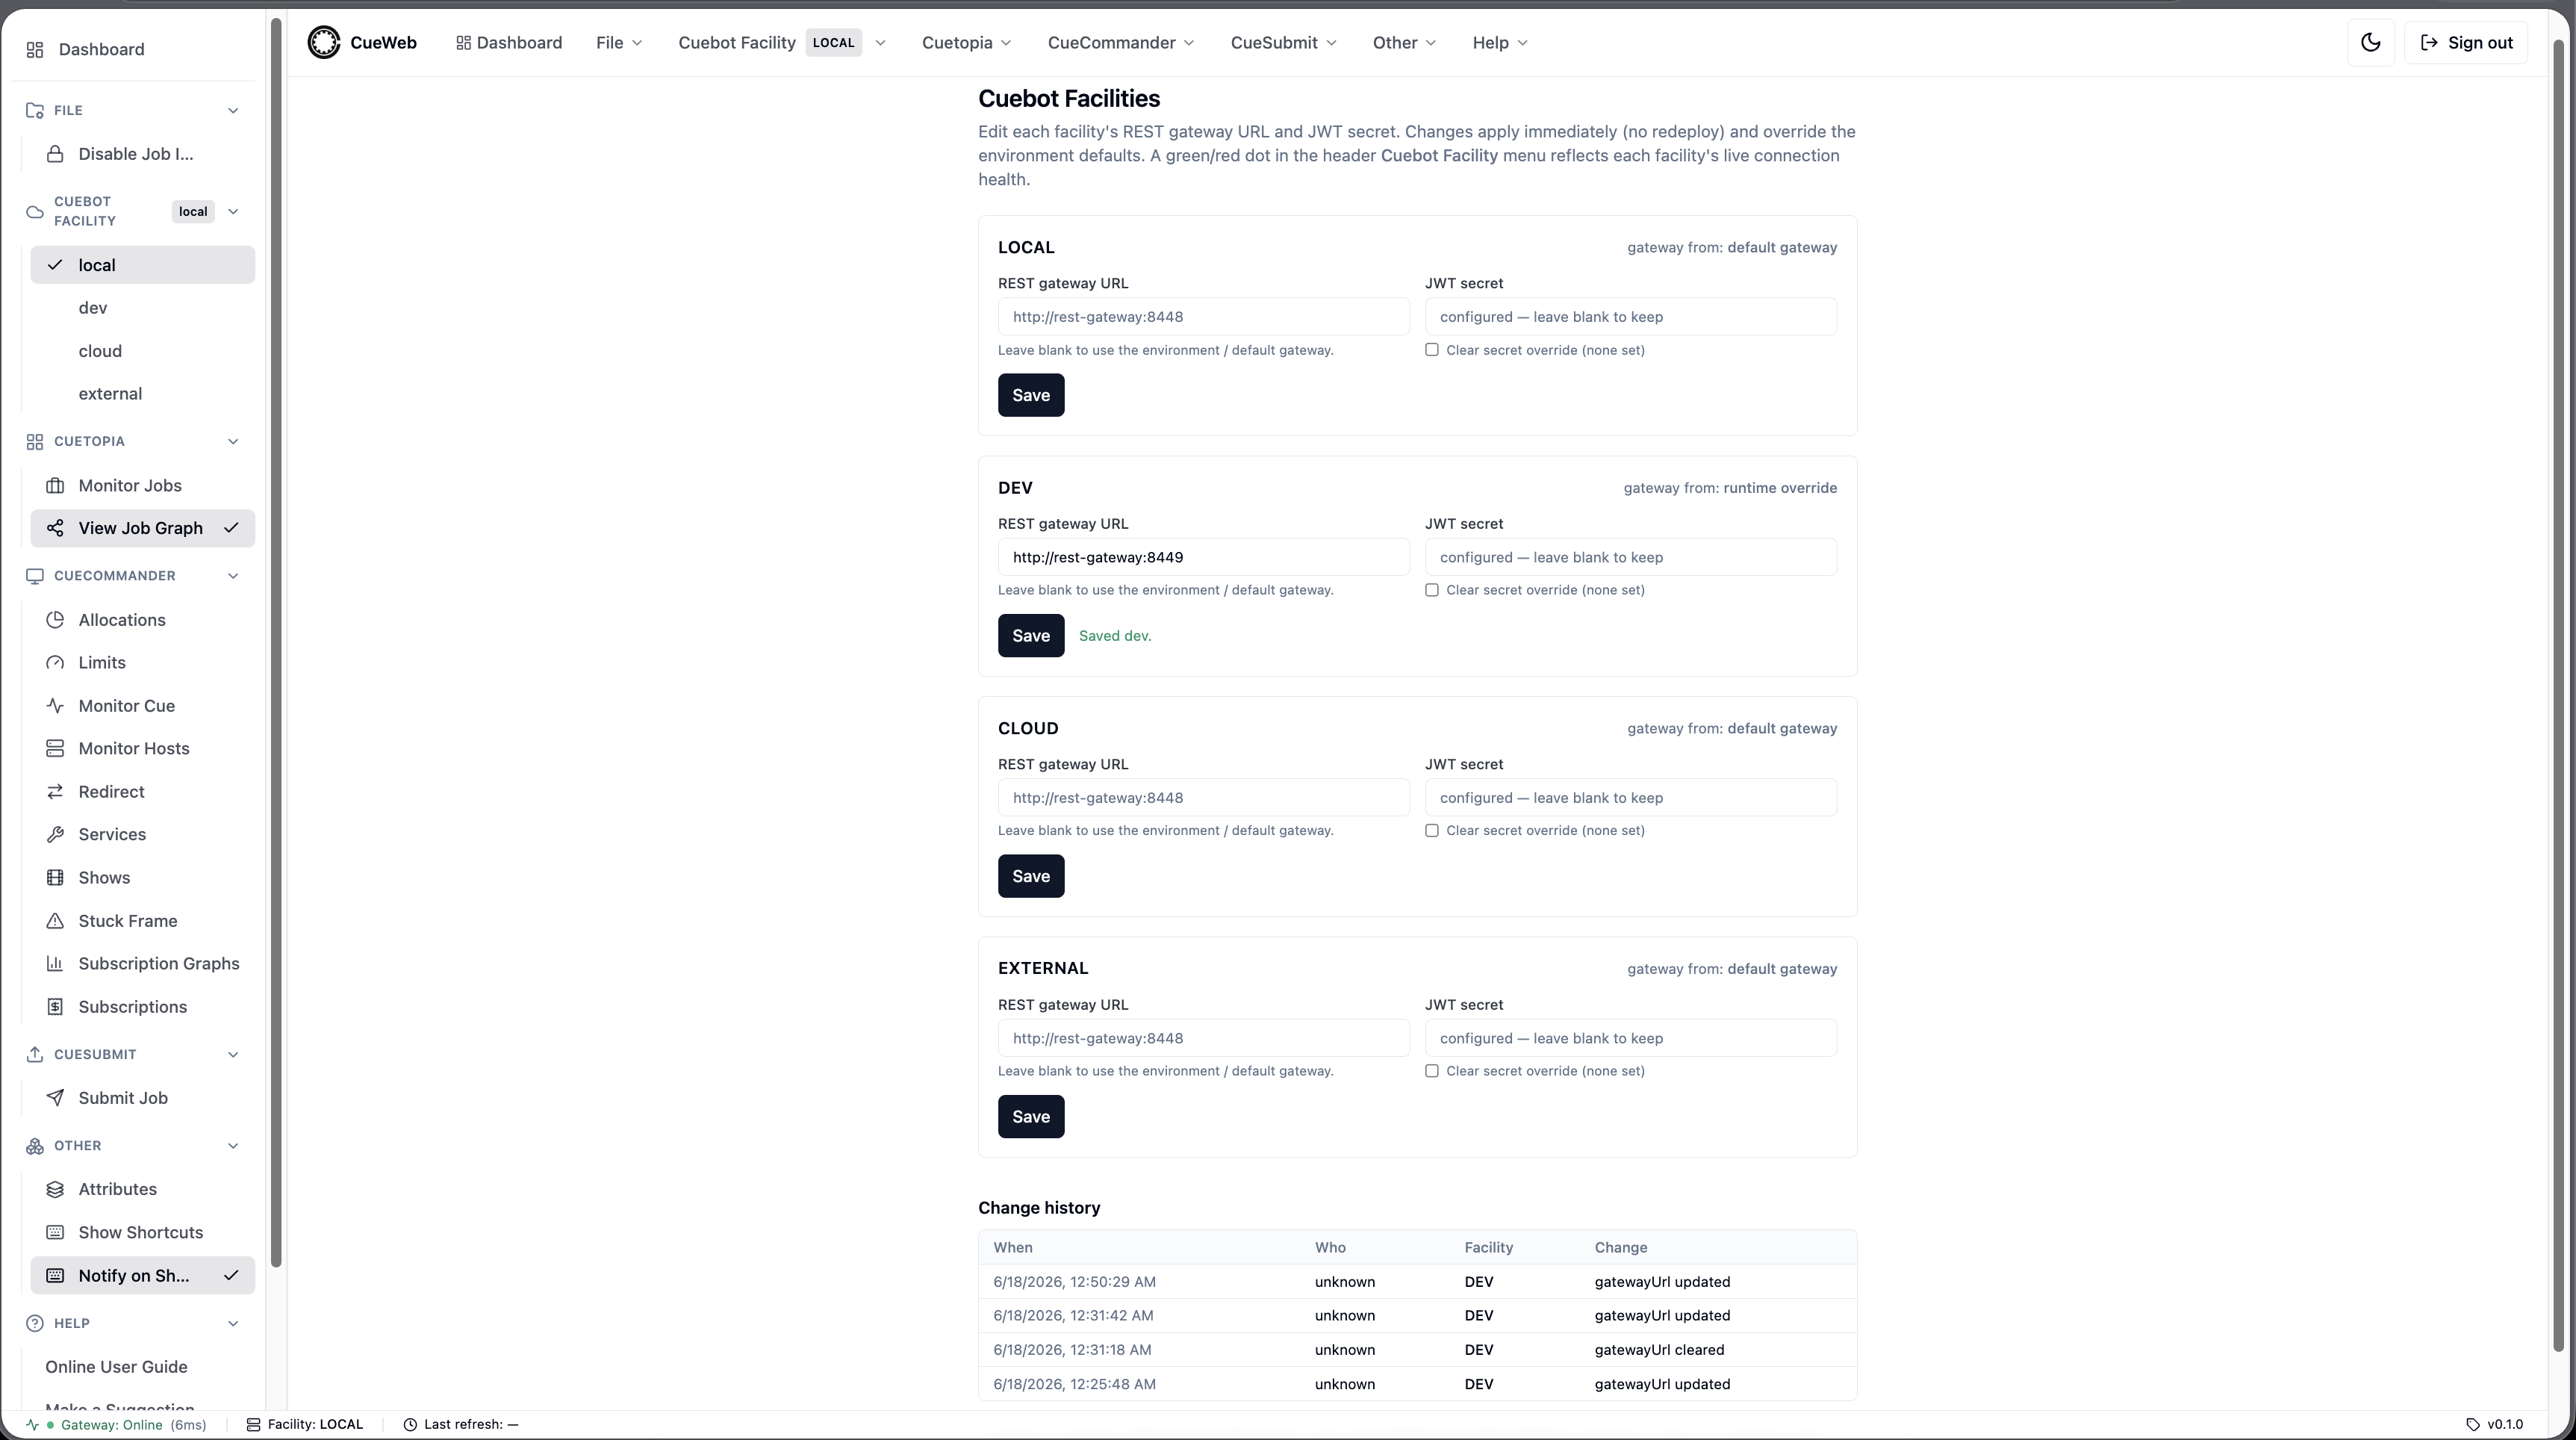
-
To keep these runtime edits across container restarts, point
CUEWEB_FACILITY_STOREat a mounted volume (otherwise they live in the OS temp dir). In a deployment with group authorization, restrict/settings/facilitiesto your admin groups.
Because the gateway URLs and secrets are server-side, the browser only ever knows the facility name - switching facilities, viewing health, or editing config never exposes a gateway credential to the client.
Checking the CueWeb version (About CueWeb)
When you file a bug or confirm a deploy, you’ll want to know exactly which build you’re running. CueWeb makes that a two-second check.
- Glance at the bottom status bar - the build version is shown at the right (e.g.
v1.4.0). -
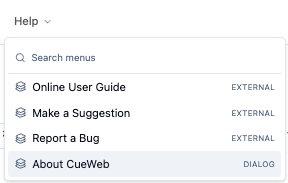
For the full picture, open the Help menu and choose About CueWeb.
-
The dialog shows the Version, the Build SHA, and a license link.
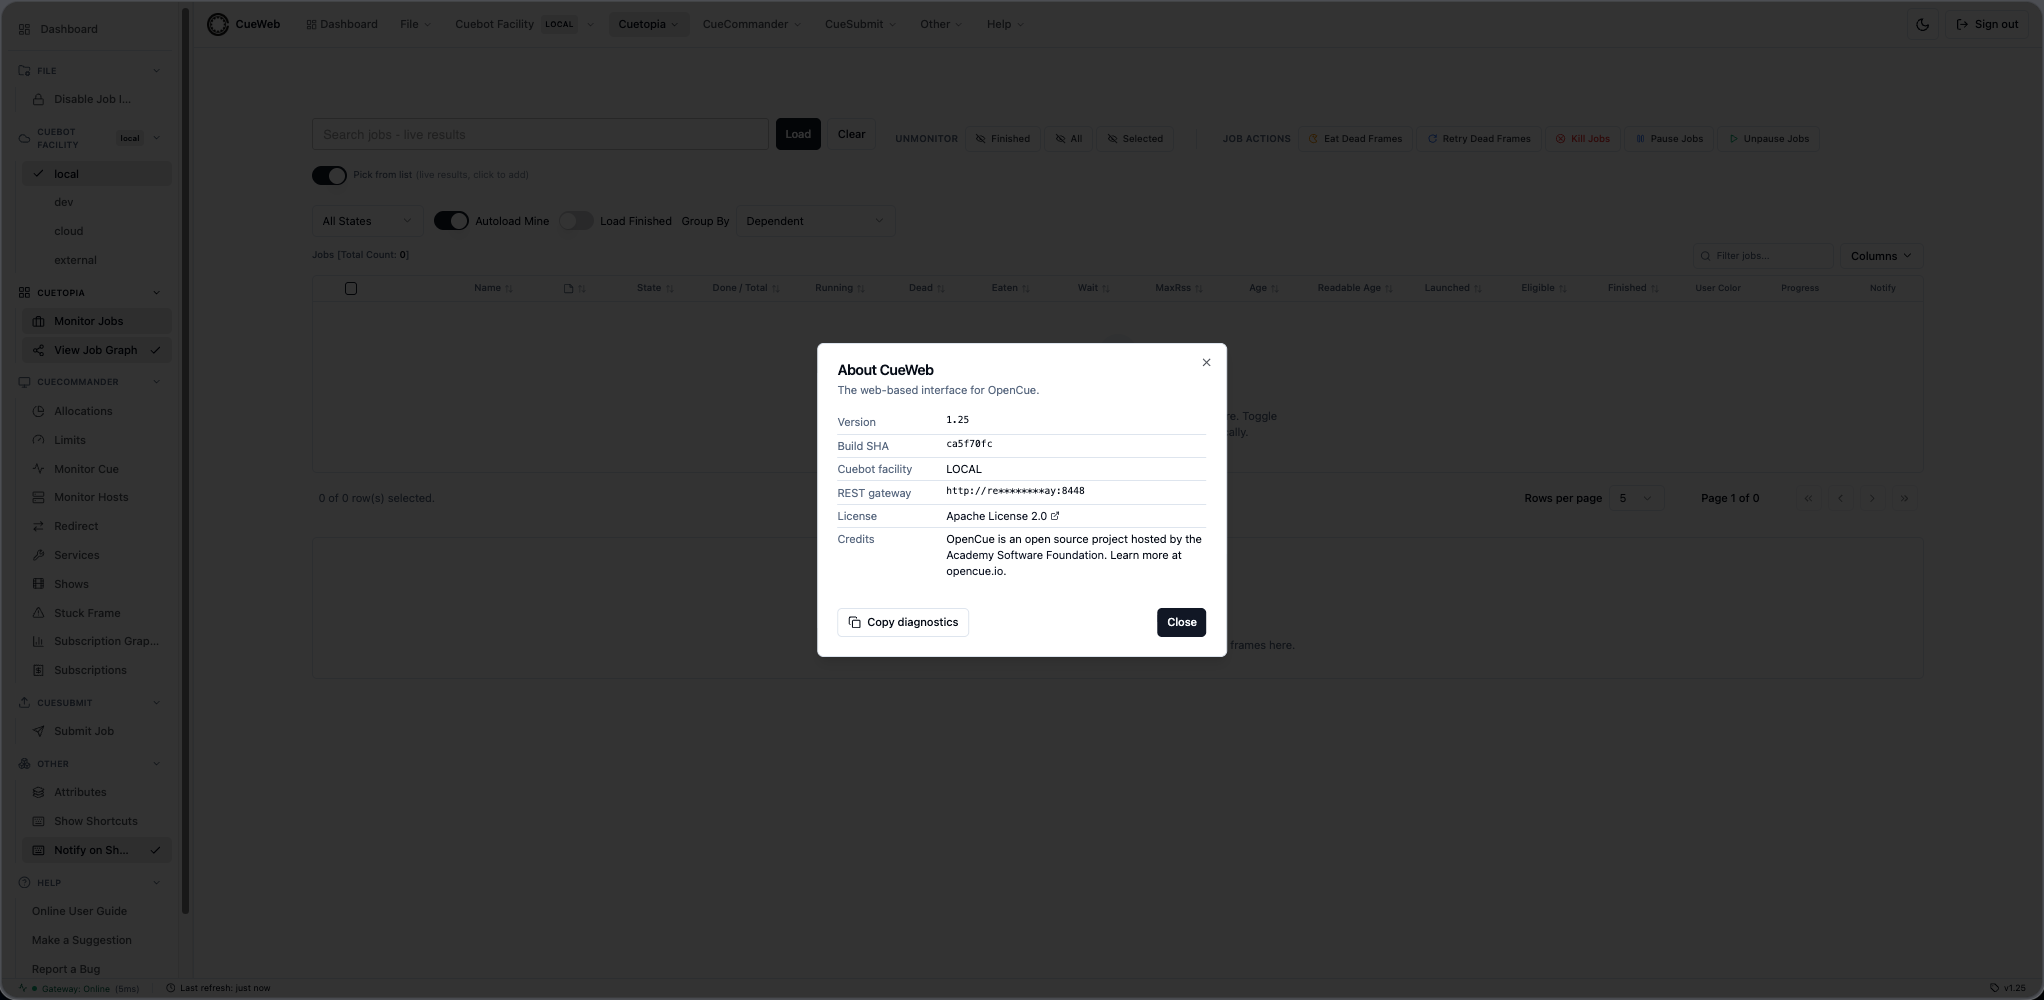
- Click Copy diagnostics to copy all of those fields as JSON, then paste them straight into a bug report - no retyping.
Good to know: the version is decided when the image is built. By default CueWeb tracks OpenCue’s shared VERSION.in, so its number matches Cuebot and CueGUI; a deployment can override it (via OVERRIDE_CUEWEB_VERSION.in or the NEXT_PUBLIC_APP_VERSION build-arg), and the Build SHA reads unknown unless CI injected NEXT_PUBLIC_GIT_SHA. See Versioning for the full chain.
Access control: restricted areas
Some deployments turn on group-based authorization, so what you can reach depends on your group membership. This is optional and off by default; here’s what it looks like when it’s on.
As a user:
- Read-only Cuetopia monitoring (Monitor Jobs, job/frame inspection, logs) and the Dashboard are typically open to everyone who can sign in.
-
If you open an area you’re not authorized for - anything under CueCommander (including Monitor Cue, Monitor Hosts and Stuck Frame), CueSubmit, or Manage facilities… - CueWeb shows an Access denied page instead of the content, and hides those menus. A non-admin sees only the unrestricted menus (Dashboard, File, Cuebot Facility, Cuetopia, Plugins, Other, Help):
- If you believe you should have access, contact your OpenCue administrator; access is decided by the groups your account belongs to, not by anything you can change in the UI.
As an administrator enabling it:
- Set
CUEWEB_AUTHZ_ENABLED=trueto turn the gate on (it’s a pure pass-through when unset). - List the groups allowed to use CueWeb at all in
CUEWEB_ALLOWED_GROUPS, and the groups allowed on the entire CueCommander section + CueSubmit + Manage facilities… inCUEWEB_ADMIN_GROUPS(empty means “everyone signed in”). - Make sure your identity provider includes the user’s groups in the login token, and point
CUEWEB_GROUPS_CLAIMat the claim that carries them (defaultgroups). Groups are read once at sign-in and enforced server-side on every request - users can’t bypass it from the browser.
See Group-based authorization for the concept and the deployment guide for the full configuration.
Reviewing the audit trail (CueWeb Audit)
CueWeb keeps an audit trail of the actions people take through it - who did what, when, to which target, and whether it worked. The CueWeb Audit page lets you read that trail, filter it, and export it. Let’s walk through it.
-
Do something auditable first so there’s a fresh entry to look at. Jump back to Pause and Resume Practice and pause a job, or use Adjusting Priority to set a job’s priority. Either action is recorded the moment it succeeds.
-
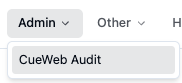
Open the audit page. From the top header (or the left sidebar) open the Admin menu and choose CueWeb Audit.
-
Read the table. Each row is one recorded action, newest first, so the pause or priority change you just made sits at the top.
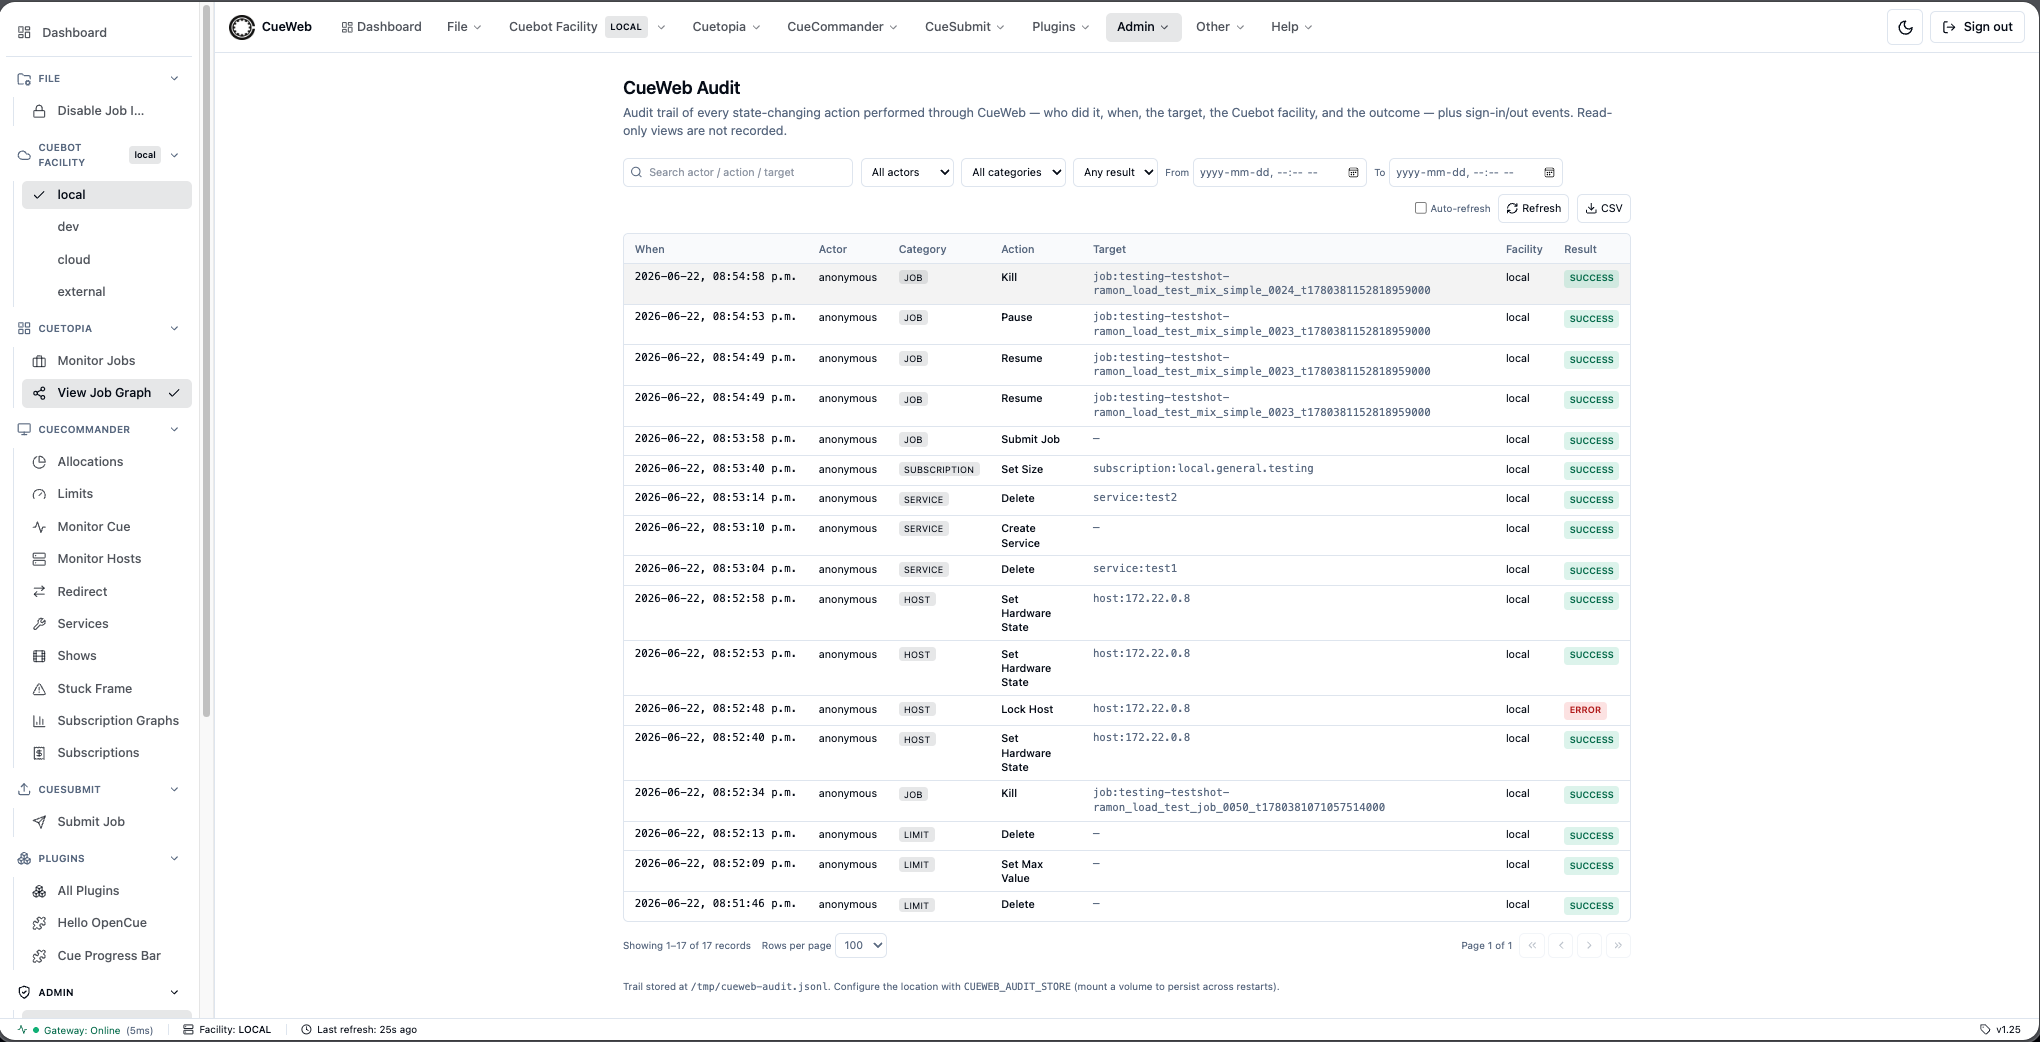
The columns are:
- When - the timestamp of the action.
- Actor - the signed-in user who performed it (or
anonymouswhen auth is off). - Category - the kind of entity acted on (e.g.
job,frame,host,show,auth). - Action - the human-friendly action (e.g. Pause Job, Set Priority, Sign in).
- Target - the entity that was acted on (e.g.
job:comp_v2). - Facility - the Cuebot facility the action was routed to.
- Result - success or error.
-
Expand a row for details. Click any row to unfold its sanitized details - the action’s parameters, the error message (if it failed), and the underlying endpoint that was called. Secrets are stripped out, so the details are safe to read and share. Click the row again to collapse it.
- Practice filtering. Narrow the trail with the controls above the table:
- Pick a Category (for example
job) or an Actor to focus on one kind of action or one person. - Use the Result filter to show only error rows when you’re chasing a failure.
- Set a From / To time window to look at a specific period.
- Type in the free-text search box to match across actors, targets, and actions.
- Click Clear to drop every filter and return to the full trail.
- Pick a Category (for example
-
Page through the results. Use First / Prev / Next / Last to move between pages, and change the rows-per-page control (default 10) when you want to see more at once.
- Watch it live, then export. Toggle auto-refresh to have the page pull new entries on an interval - handy while you’re actively making changes. When you want a copy, click Export to CSV to download exactly the rows currently in view (filters included).
What gets recorded: CueWeb Audit captures state-changing actions performed through CueWeb - kill / pause / resume / eat / retry, priority and core changes, comments, job submit, host actions (lock, reboot, allocation, tags, delete, redirect), and show / allocation / limit / subscription edits - plus Sign in and Sign out. Read-only views (opening Monitor Jobs, viewing logs, browsing details) are not recorded, and actions taken from CueGUI,
cueman, orpycueare not captured. Access to the page is admin-gated: when no group-based authorization is configured it’s visible to everyone, otherwise only members of your admin groups can reach it (see Access control: restricted areas).
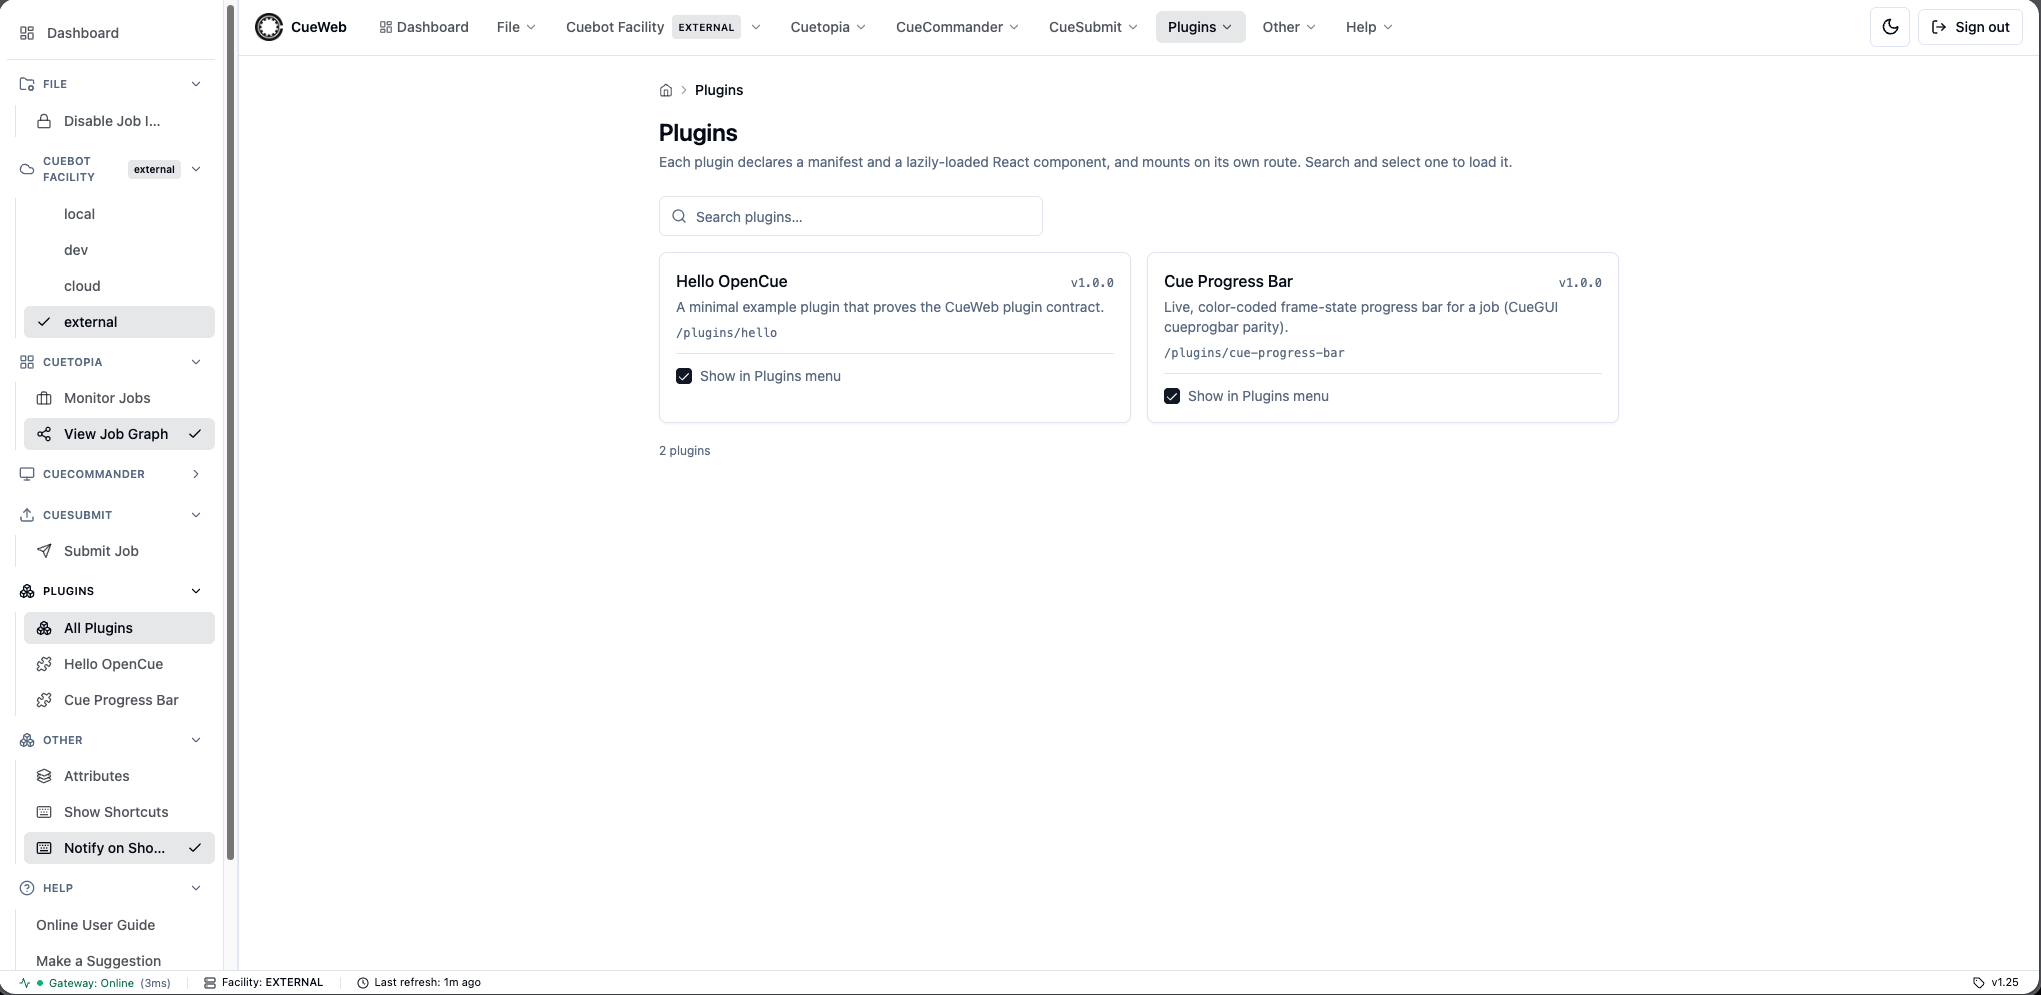
Using plugins
CueWeb can be extended with plugins - add-on panels that live on their own pages. Two samples ship in the box; here’s how to use them.
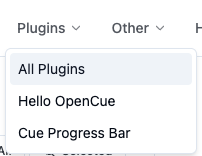
-
Open the Plugins page. The Plugins menu sits in the header (and sidebar) to the right of CueSubmit. Open the menu and pick Plugins to see every registered plugin.
-
Choose what’s in your menu. Each plugin has a checkbox. Tick the ones you want in the Plugins menu and untick the rest - your choice is saved in your browser and follows you across tabs. (Cue Progress Bar is on by default; Hello OpenCue is off.)
-
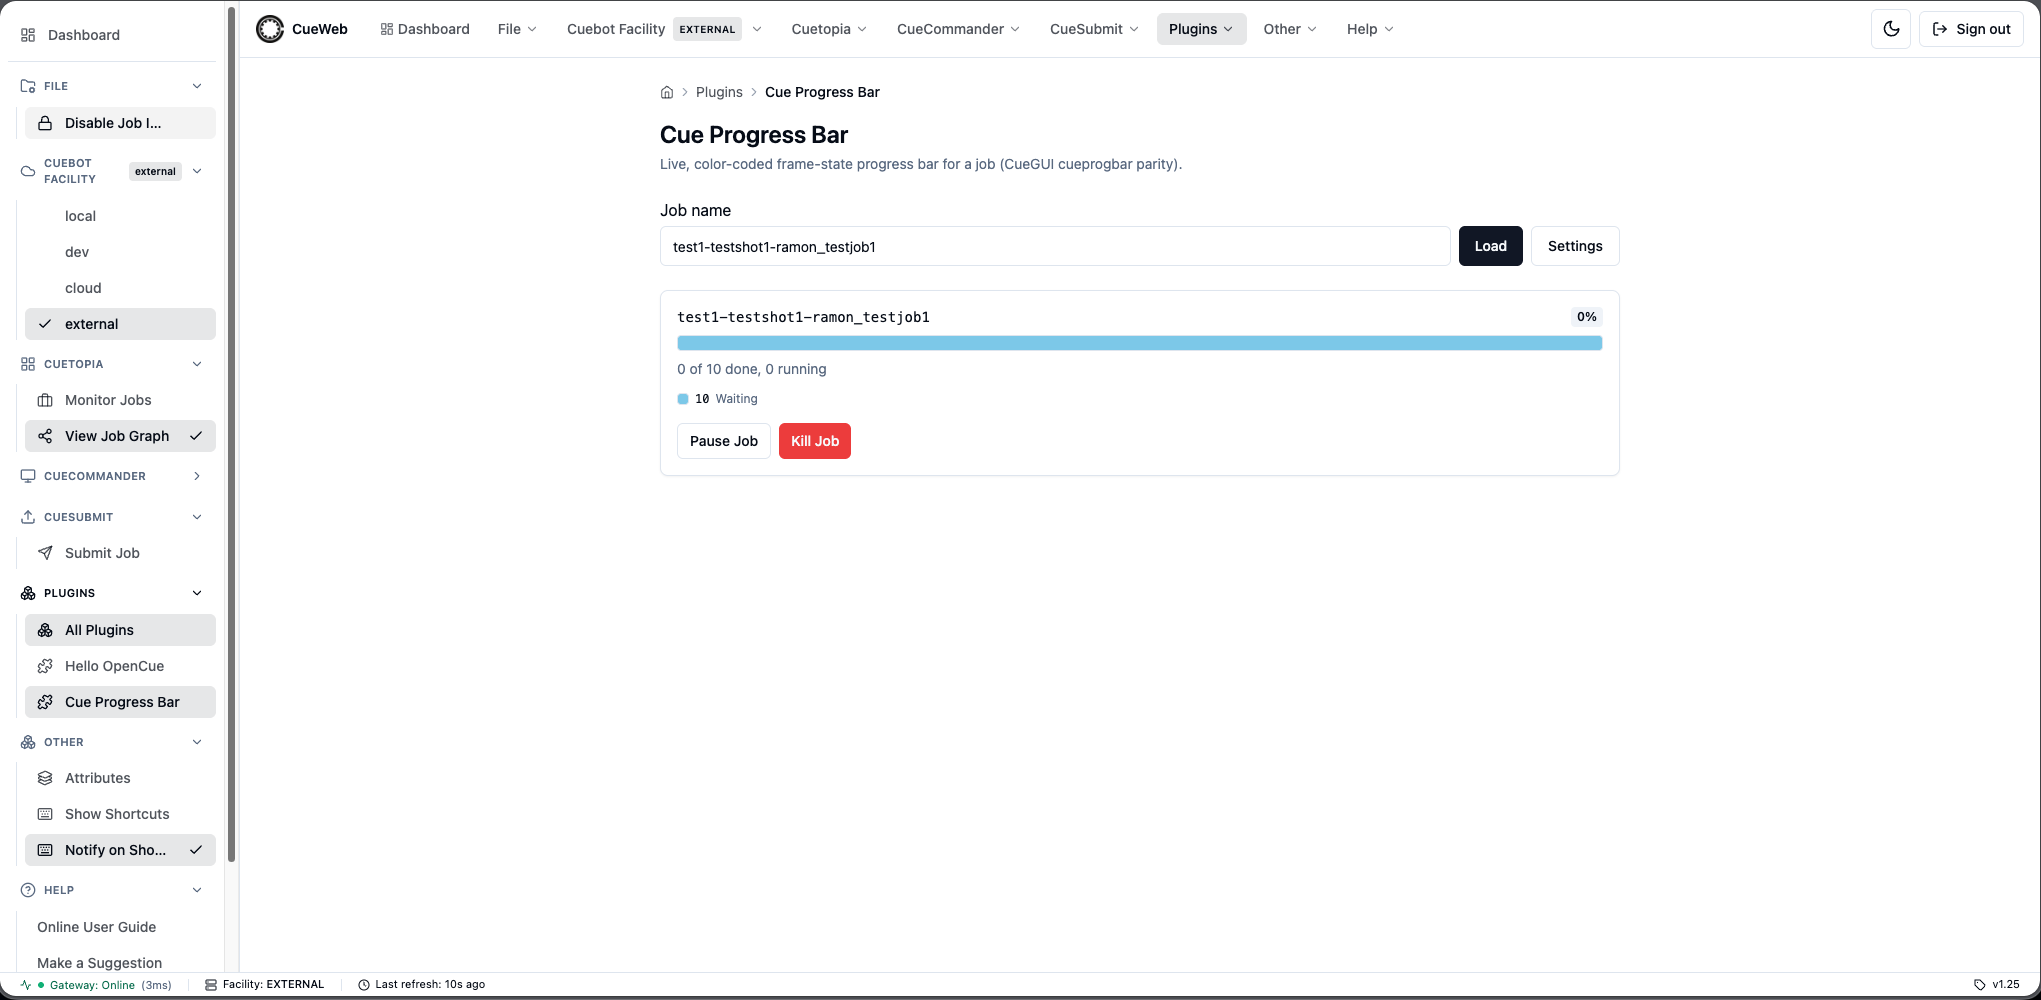
Open a plugin and try it. Pick Cue Progress Bar from the menu. Point it at a job and you’ll see a live, color-coded frame-state bar with done / total / running counts and pause / unpause / kill / retry-dead controls; it polls Cuebot on an interval you can configure.
-
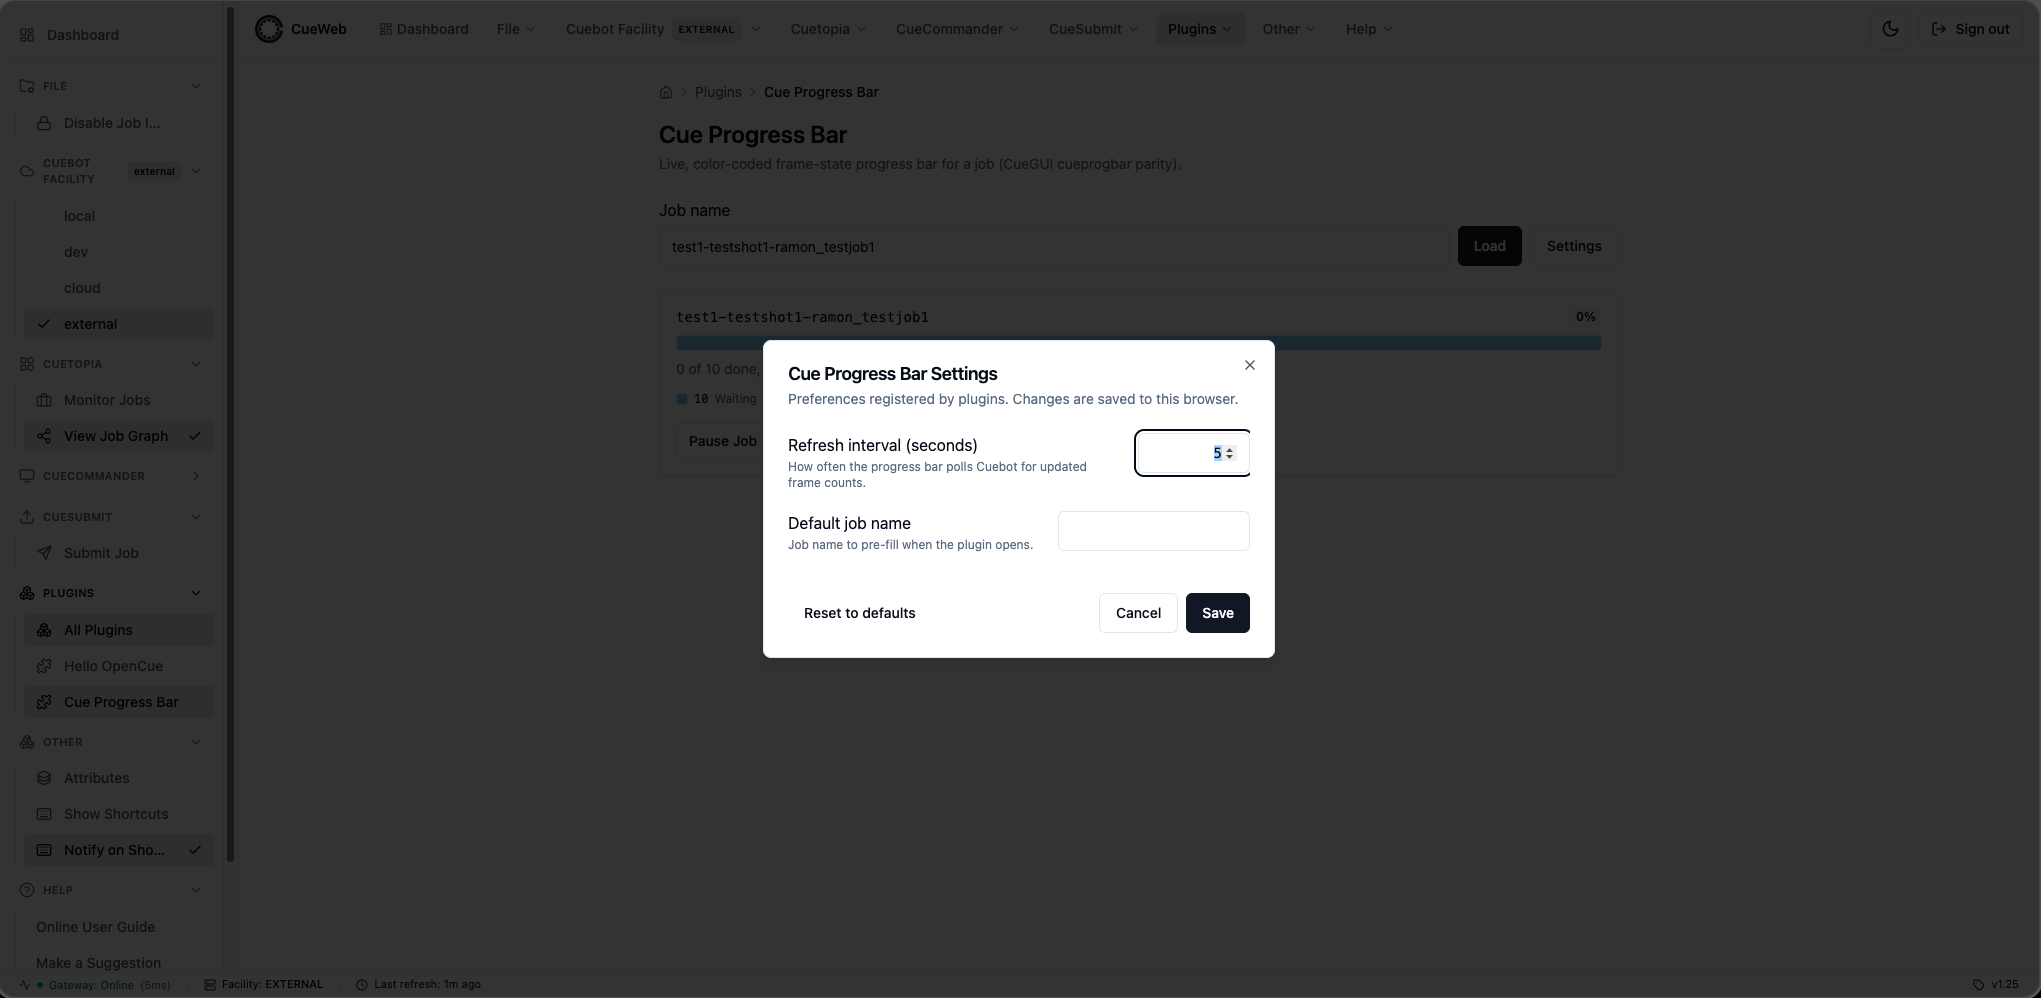
Adjust its settings. Use the Open plugin settings control to change that plugin’s options (for Cue Progress Bar, the poll interval; for Hello OpenCue, the greeting / shout / emoji). The dialog is scoped to that one plugin, and each value persists in your browser.
Want to build your own? A plugin is just a manifest plus a React component under
cueweb/app/plugins/<name>/. See the developer guide.
Customizing your workspace
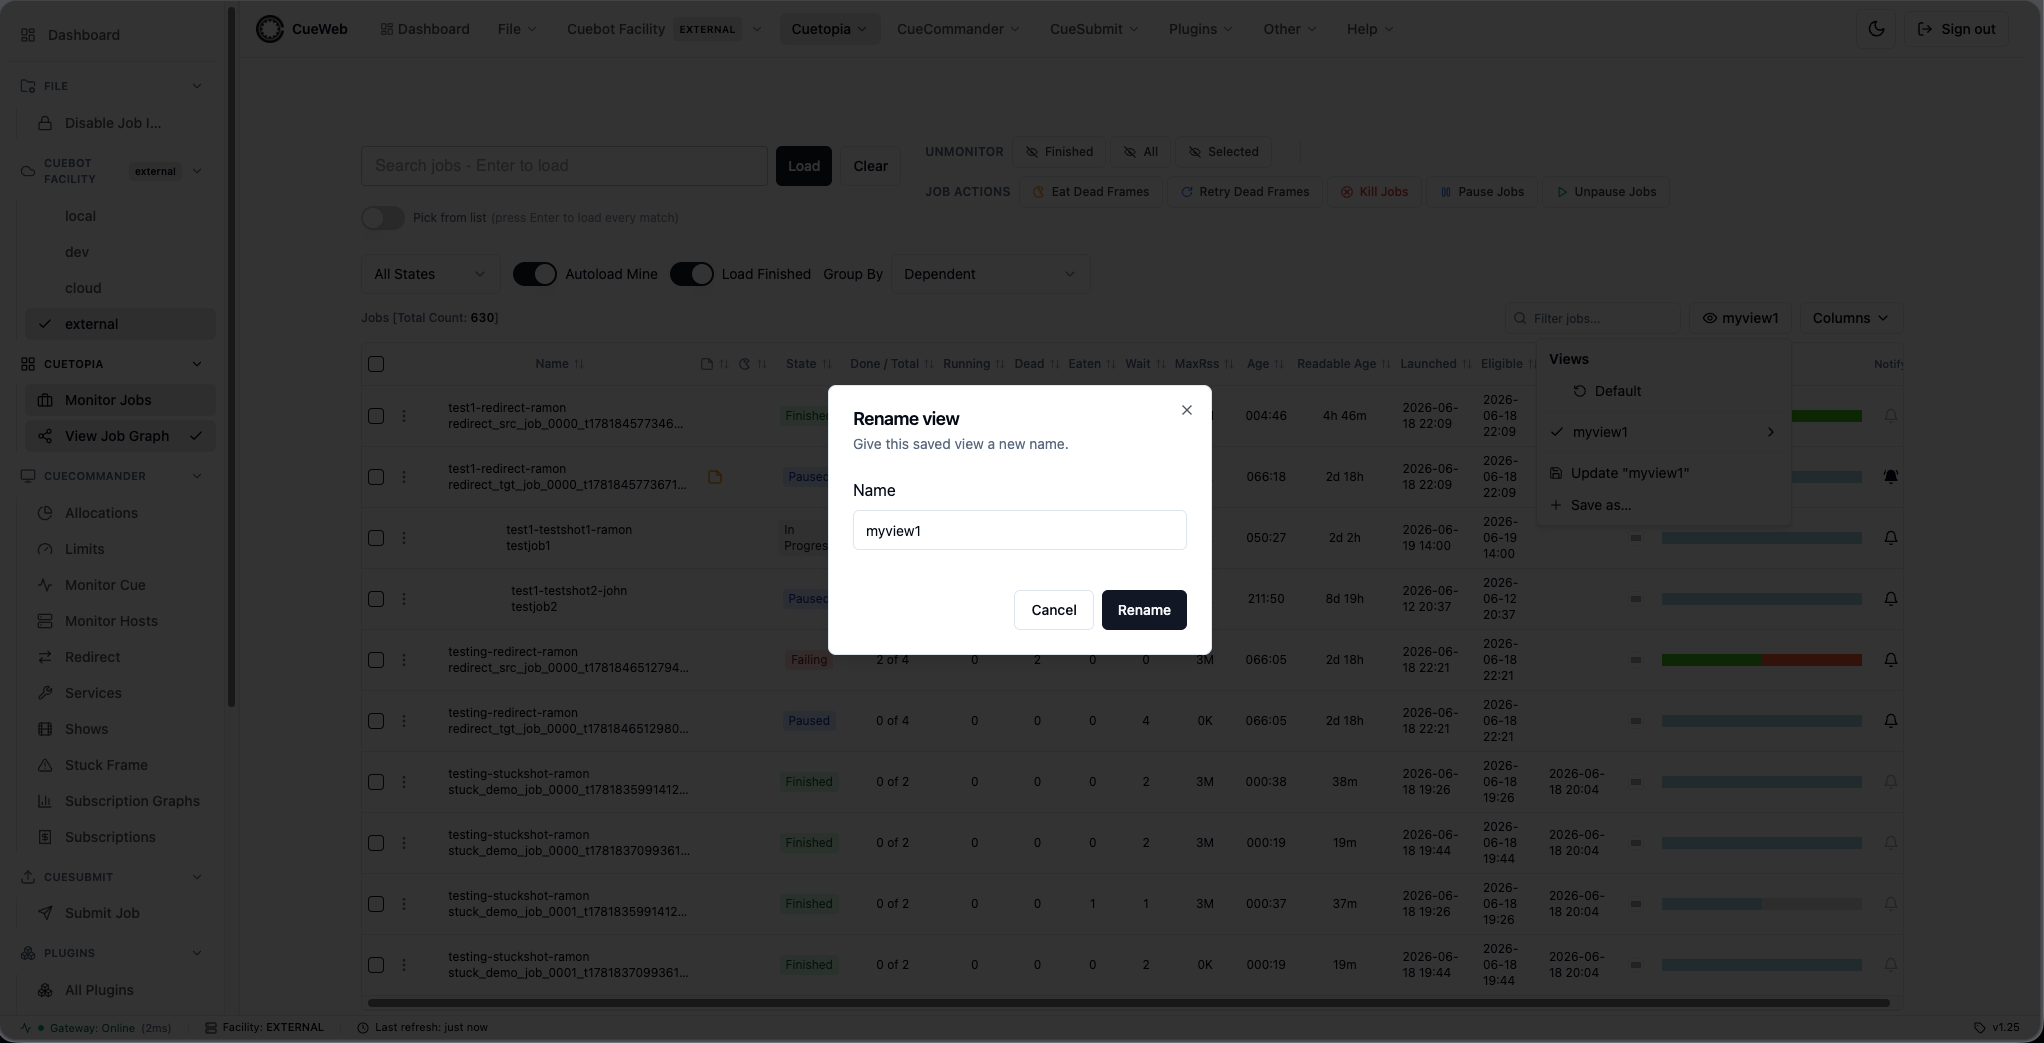
CueWeb gives you three ways to tailor the workspace - and all three remember your choice in the browser. Let’s try each.
Save and reuse a view preset
-
Go to Monitor Jobs. Set the table up the way you like - reorder or hide a few columns, sort by a column, apply a filter, change the page size.
-
Open the Views dropdown (next to Columns) and choose Save as…. Give the preset a name (for example
Triage) and save.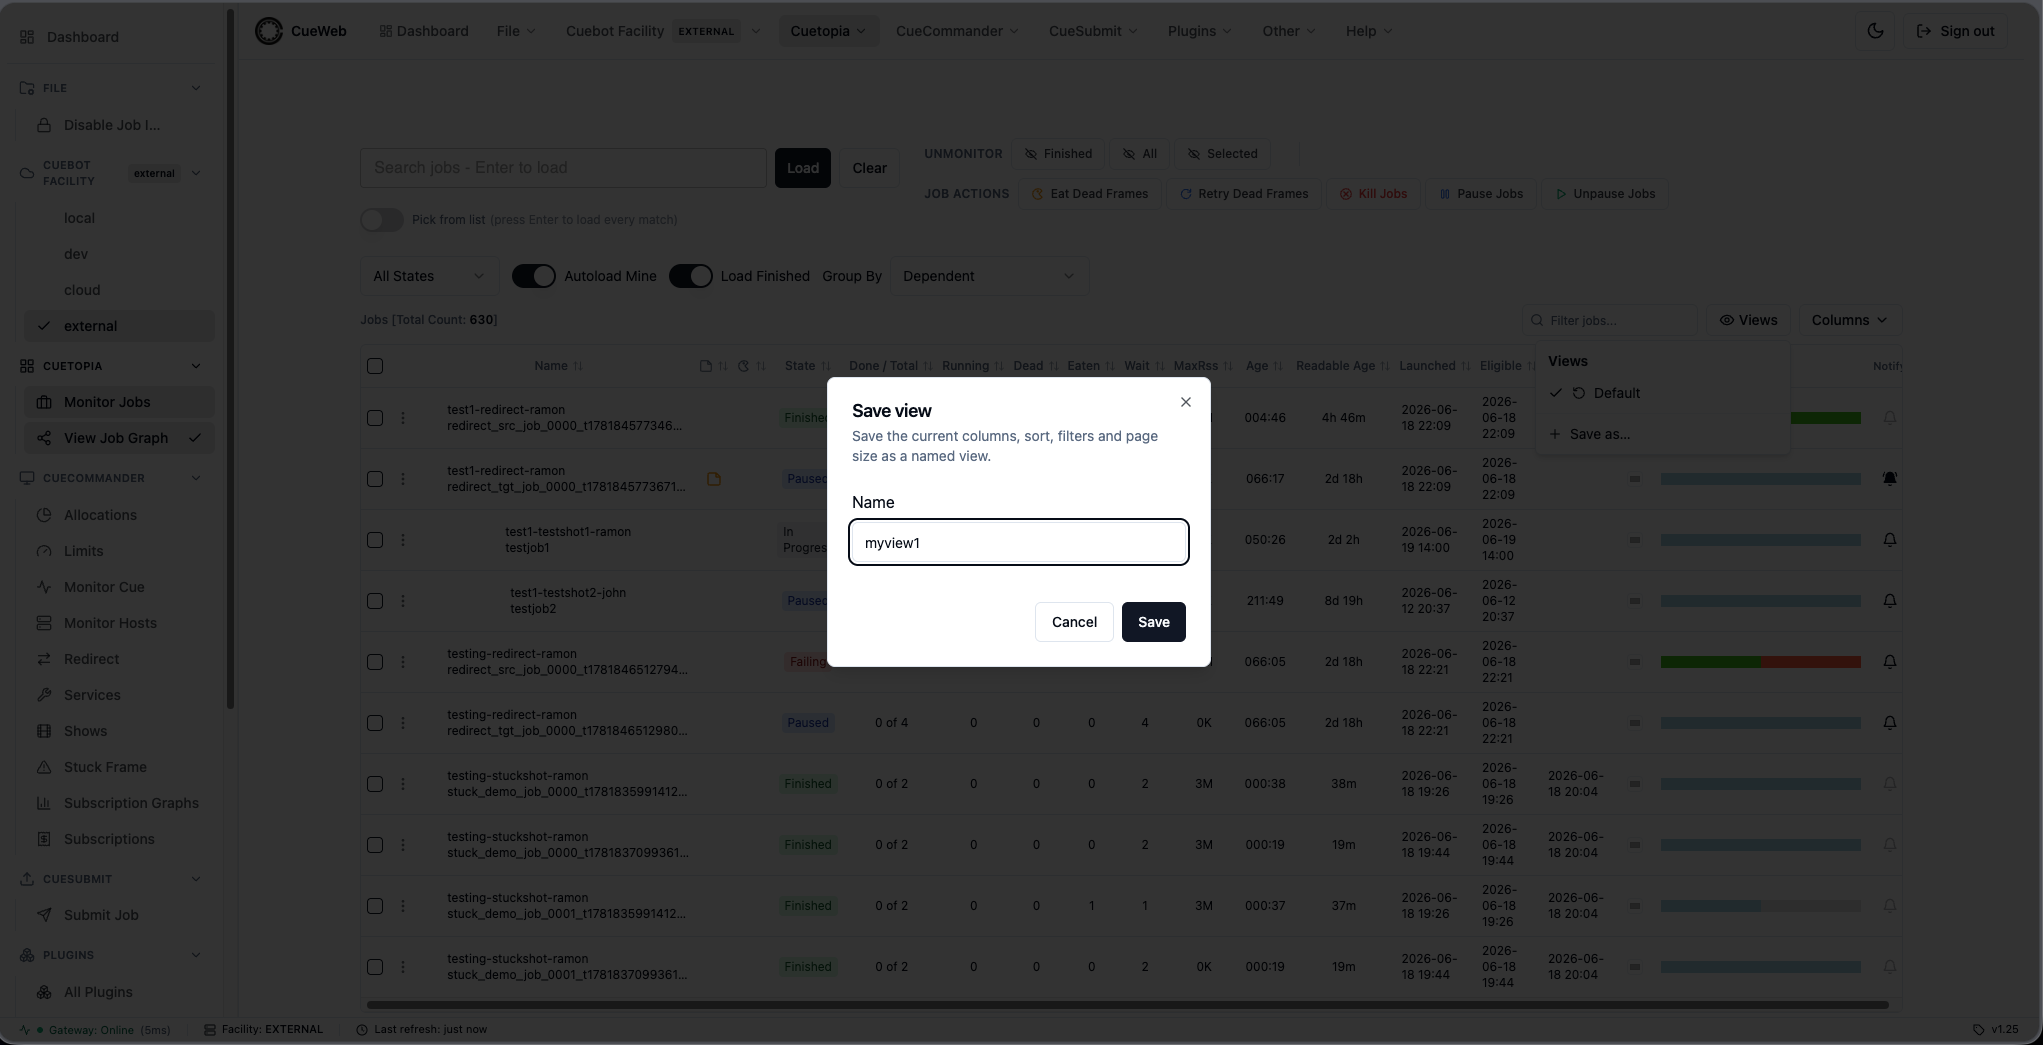
-
Change the table around, then reopen Views and click Triage - the saved layout snaps back. The Default entry always restores the original layout.
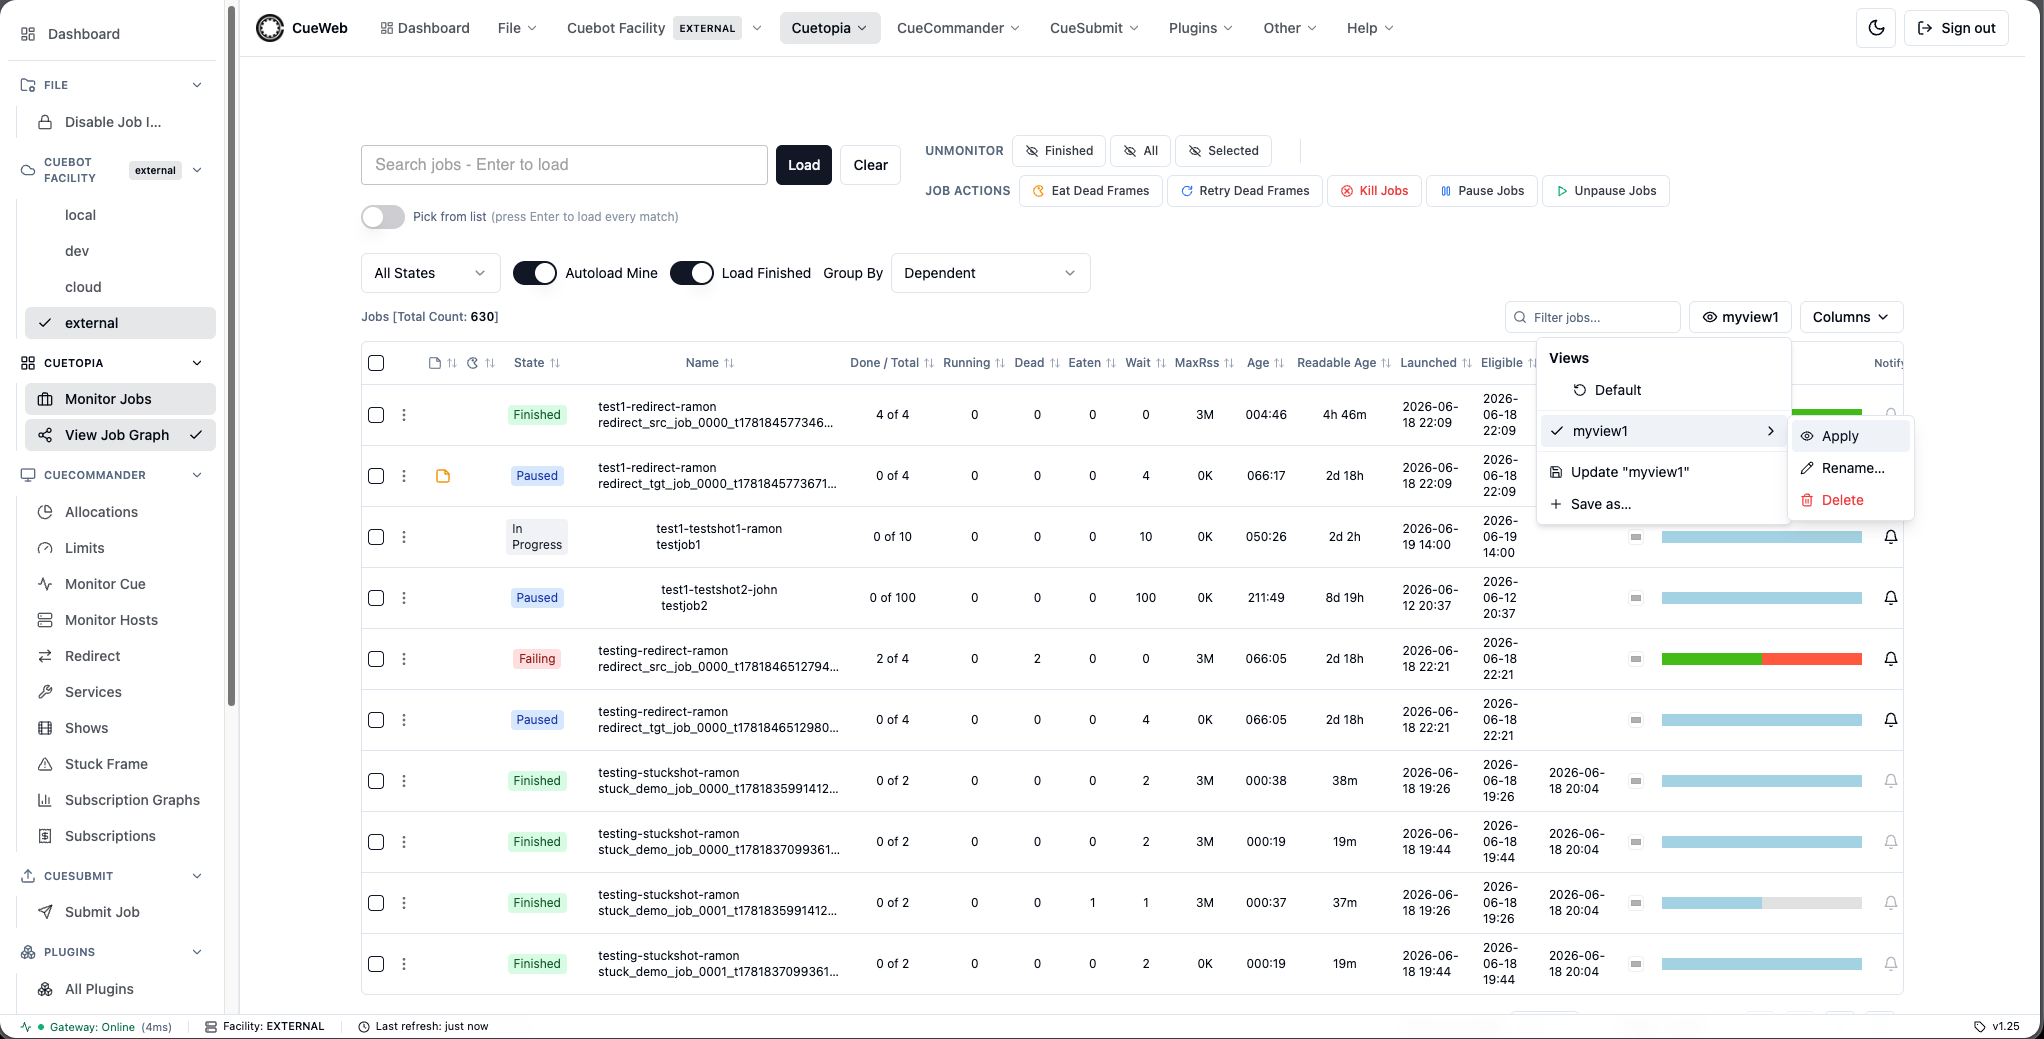
-
Use the inline Rename / Delete buttons to manage presets, or Update “Triage” to overwrite it with the current layout. Presets are per page and follow you across tabs.
Go full-screen (immersive mode)
-
Press
F(or open Other → Immersive (full-screen)). The header, sidebar, and status bar disappear, and the table takes the whole screen.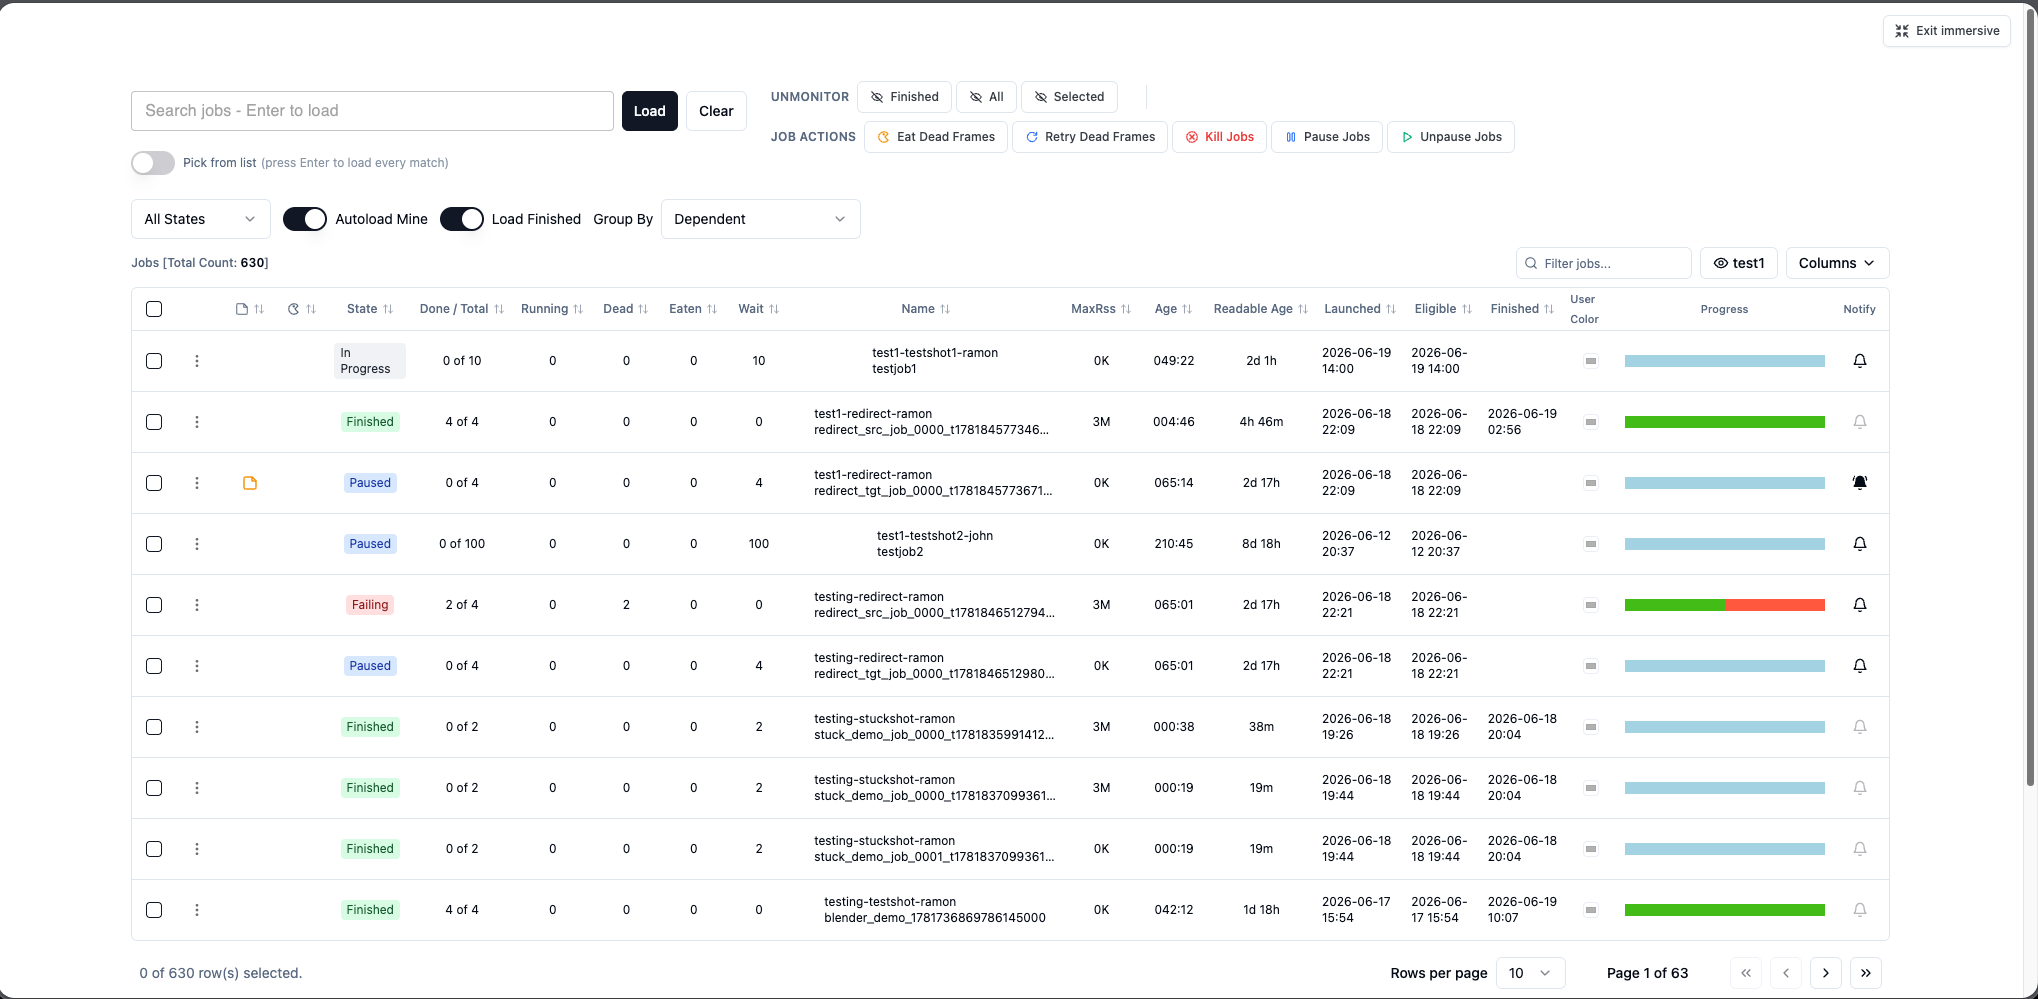
-
Press
Fagain, or click the floating Exit immersive button, to bring the chrome back. The mode is remembered, so a new tab opens immersed too until you turn it off.
Work in a split view
-
Open Other → Split view. CueWeb shows two pages side-by-side - Jobs on the left, Hosts on the right by default.
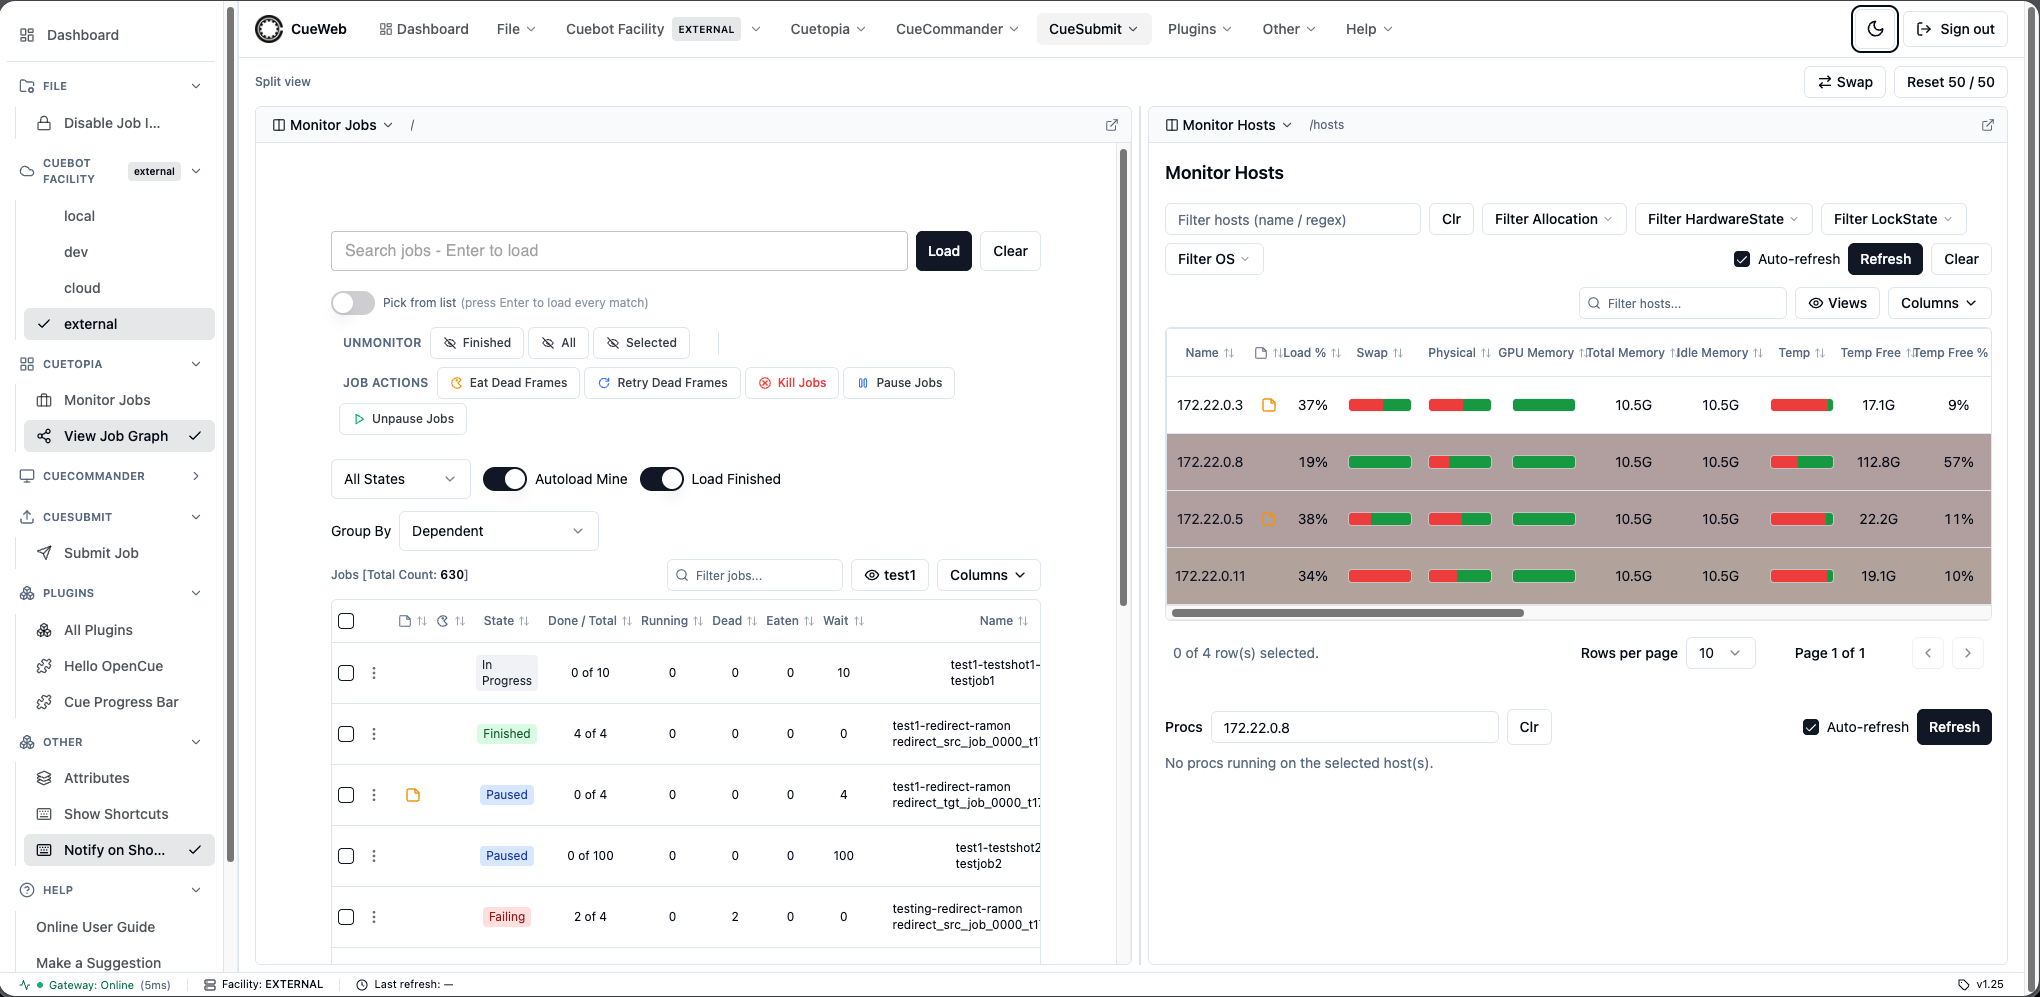
- Use each pane’s page picker to choose what it shows (for example, put Monitor Jobs on the left and a specific host’s detail page on the right).
- Drag the divider to rebalance the panes (or nudge it with the arrow keys); use Swap to flip them and Reset 50/50 to re-center.
- Notice the address bar:
/split?left=…&right=…. The whole workspace is in the URL, so you can bookmark or share it, and a reload restores both panes exactly.
Troubleshooting Common Issues
Frame Failures
When frames fail repeatedly:
- Check Frame Logs:
- Click failed frame numbers
- Look for error patterns
- Note resource usage
- Common Issues:
- Memory errors: Frames running out of RAM
- File not found: Missing assets or incorrect paths
- License errors: Software license unavailable
- Timeout errors: Frames taking too long
- Resolution Steps:
- Retry individual frames
- Adjust memory requirements
- Check asset availability
- Contact technical support
Performance Issues
When jobs run slowly:
- Check Resource Allocation:
- Verify core and memory settings
- Look for resource conflicts
- Monitor host utilization
- Optimization Strategies:
- Increase priority for urgent jobs
- Pause non-critical jobs
- Adjust core allocations
- Balance workload across hosts
Additional Resources
- CueWeb User Guide - Complete reference manual
- CueWeb Developer Guide - For customization and development
- REST API Reference - For automation and integration
- OpenCue Community - Support and discussion