CueGUI: Cuetopia Monitoring System
CueGUI is the graphical user interface for OpenCue, divided into two main workspace views:
- Cuetopia: The artist-focused view for monitoring and managing render jobs
- CueCommander: The administrator-focused view for system monitoring and host management
This guide provides comprehensive documentation for Cuetopia, which includes the Monitor Jobs, Monitor Job Details, and Job Graph plugins used by artists and system administrators to track render job progress and troubleshoot issues.
Table of Contents
- Monitor Jobs Plugin
- Monitor Job Details Plugin
- Job Graph Plugin
- CueProgBar - Progress Bar Window
- Filters and Search Capabilities
- Data Processing and Updates
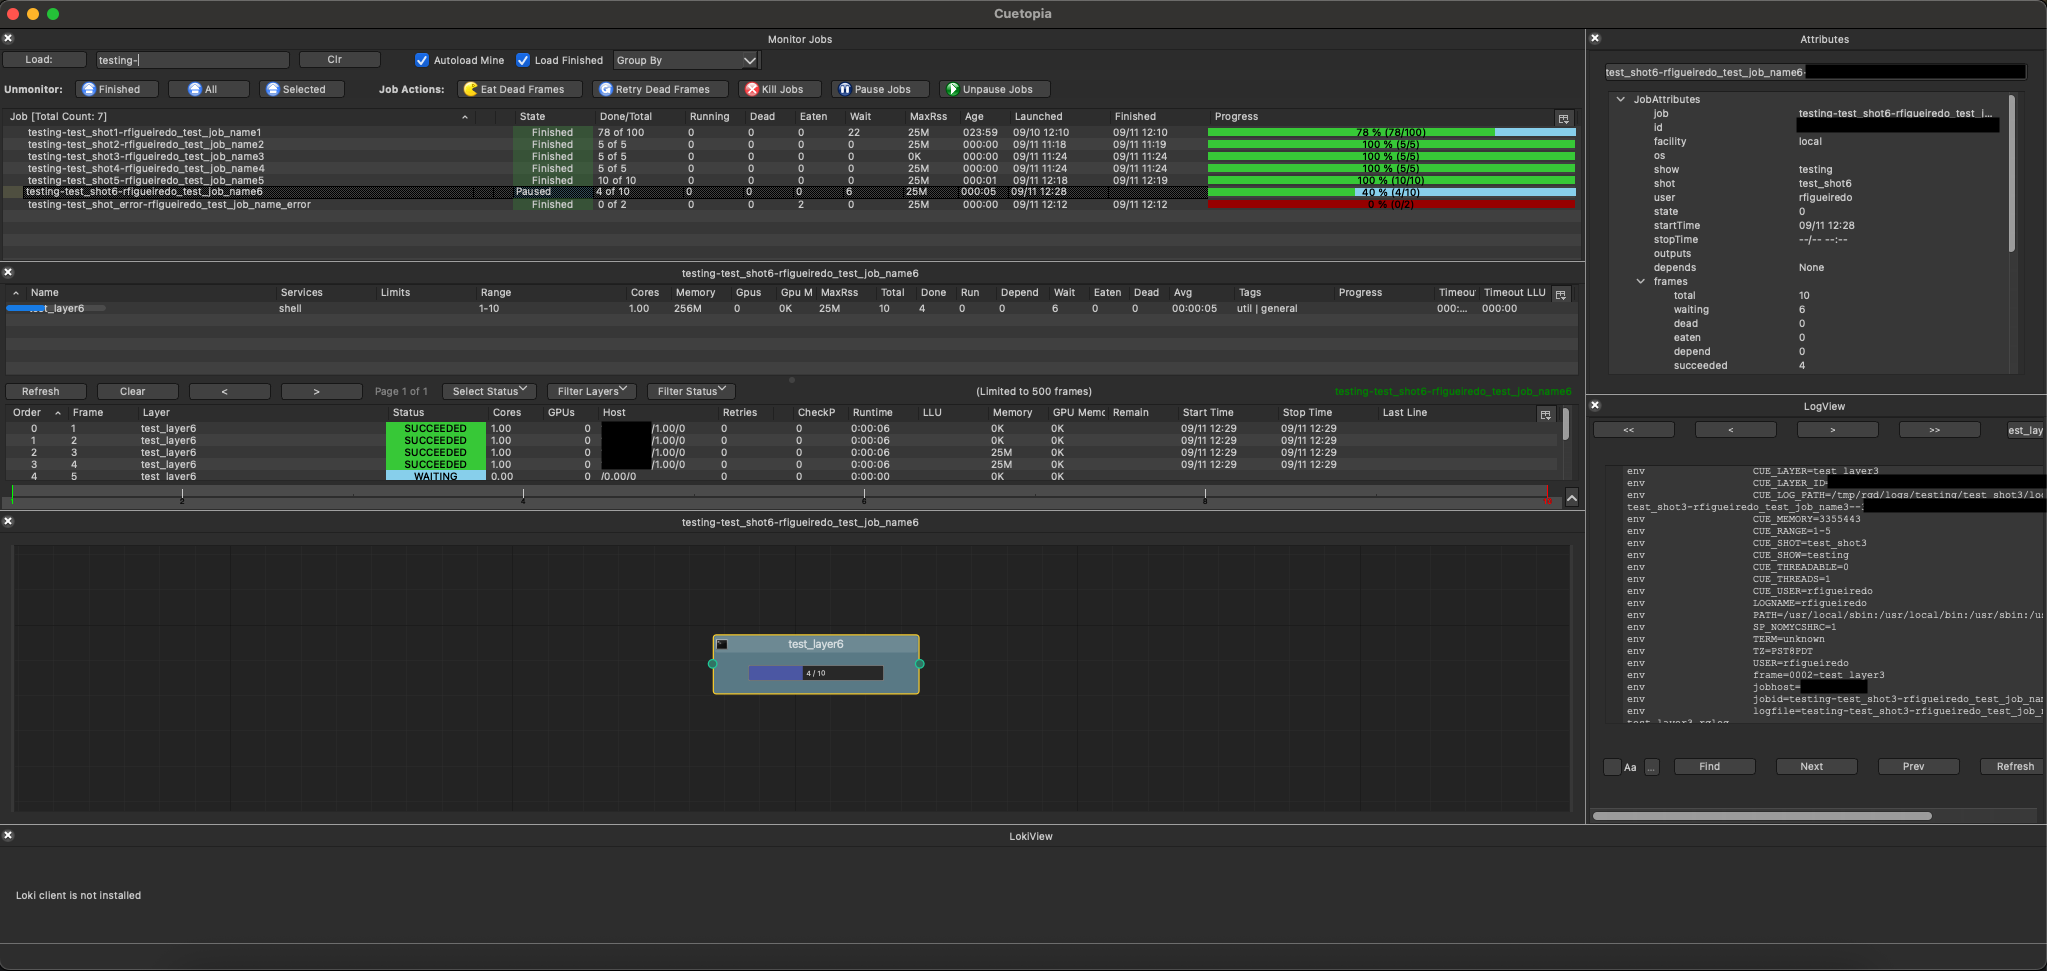
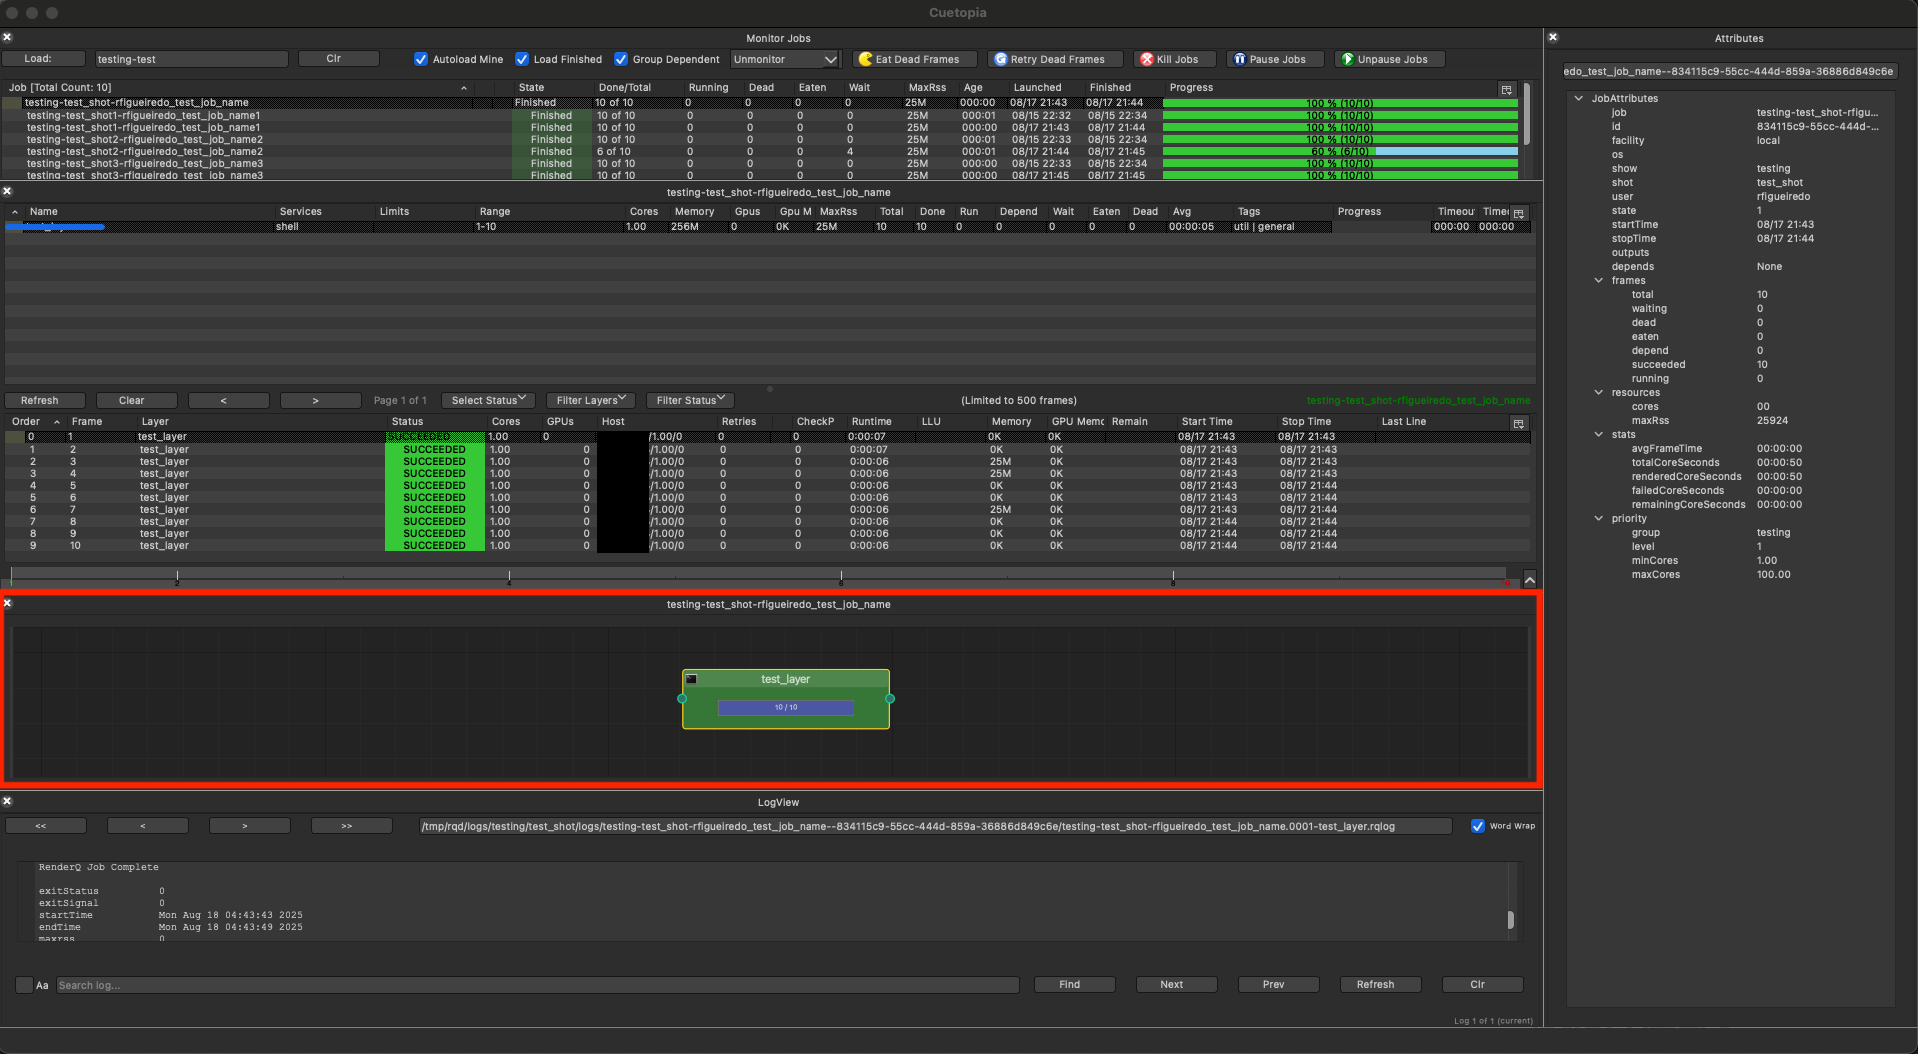
Monitor Jobs Plugin
How to Open: Go to View/Plugins > Cuetopia > Monitor Jobs
The Monitor Jobs plugin is the primary interface for monitoring active and completed render jobs. It provides a comprehensive overview of all jobs with real-time status updates.
Interface Components
Top Toolbars
The plugin uses two toolbars organized as follows:
First Toolbar (Search and Filter Controls)
- Load Button: Triggers job search based on the text field content
- Search Text Field: Accepts job search patterns:
- Job names (supports wildcards and regex)
- Show-shot patterns (e.g.,
show-shot-username) - User names to load all jobs for a user
- Job UUIDs for direct job loading
-
Clear (Clr) Button: Clears the search field
- Autoload Mine Checkbox:
- When checked, automatically loads jobs owned by the current user
- Updates on application start and facility changes
- Load Finished Checkbox:
- Includes finished jobs in search results
- Limited to jobs finished within the last 3 days
- Jobs older than 3 days are moved to historical database
- Group By Dropdown:
- Clear: No grouping (flat list)
- Dependent: Group by job dependencies
- Show-Shot: Group by show and shot
- Show-Shot-Username: Group by show, shot, and username
Second Toolbar (Action Buttons)
From left to right:
Unmonitor group:
- Finished (eject icon): Removes all finished jobs from monitoring
- All (eject icon): Clears all jobs from the monitor
- Selected (eject icon): Removes selected jobs
Job Actions:
- Eat Dead Frames (pac-man icon): Eats all dead frames for selected jobs to free scheduling resources
- Retry Dead Frames (circular arrow): Retries all dead frames for selected jobs
- Kill Jobs (X icon): Kill selected jobs and their running frames
- Pause Jobs (pause icon): Pause selected job
- Unpause Jobs (play icon): Unpause selected jobs
Job Table Columns
The Monitor Jobs view displays the following columns:
Notes:
- Dead frames: Frames that have failed to render due to errors (crashed, timed out, or encountered fatal errors during processing). These frames need to be retried or eaten to proceed.
- Eaten frames: Frames manually marked as complete without re-rendering. Used to skip problematic frames that are acceptable as-is, will be fixed in compositing, or are not critical to the final output. This allows the job to continue without being blocked by problematic frames.
| Column | Description | Data Source | Update Behavior |
|---|---|---|---|
| Job | Full job name (show-shot-user_descriptor) | job.data.name |
Static |
| State | Current job state (Finished, In Progress, Paused, Failing, Dependency) | Calculated from job stats | Real-time |
| Done/Total | Succeeded frames / Total frames | job_stats.succeeded_frames / total_frames |
Real-time |
| Running | Number of currently running frames | job_stats.running_frames |
Real-time |
| Dead | Number of dead/failed frames | job_stats.dead_frames |
Real-time |
| Eaten | Number of eaten frames | job_stats.eaten_frames |
On update |
| Wait | Number of waiting frames | job_stats.waiting_frames |
Real-time |
| MaxRss | Maximum memory used by any frame | job_stats.max_rss |
On update |
| Age | Time since job launch (HH:MM format) | Calculated from start_time |
Real-time |
| Launched | Job launch timestamp | job.data.start_time |
Static |
| Finished | Job completion timestamp | job.data.stop_time |
On completion |
| User Color | User-assigned color name (preset or custom RGB format) | __userColors dictionary |
On color change |
| Progress | Visual progress bar | Composite of all frame states | Real-time |
Additional Columns (Hidden by Default)
- Comment Icon: Shows if job has comments
- Autoeat Icon: Displays pac-man icon if auto-eating is enabled
Job State Determination
The job state displayed follows this priority logic:
- Finished: Job has completed all frames
- Paused: Job is manually paused
- Failing: Job has dead frames
- Dependency: All pending frames are waiting on dependencies
- In Progress: Default running state
Progress Bar Visualization
The progress bar uses color coding to represent frame states:
- 🟢 Green: Successfully completed frames
- 🟡 Yellow: Currently running frames
- 🔴 Red: Dead/failed frames
- 🟣 Purple: Frames waiting on dependencies
- 🔵 Light Blue: Frames waiting to be dispatched
Right-Click Context Menu
Right-clicking on a job provides these actions:
- View job details
- Manage dependencies
- Modify job properties
- Kill/pause/resume job
- Eat/retry frames
- Add comments
- Use local cores
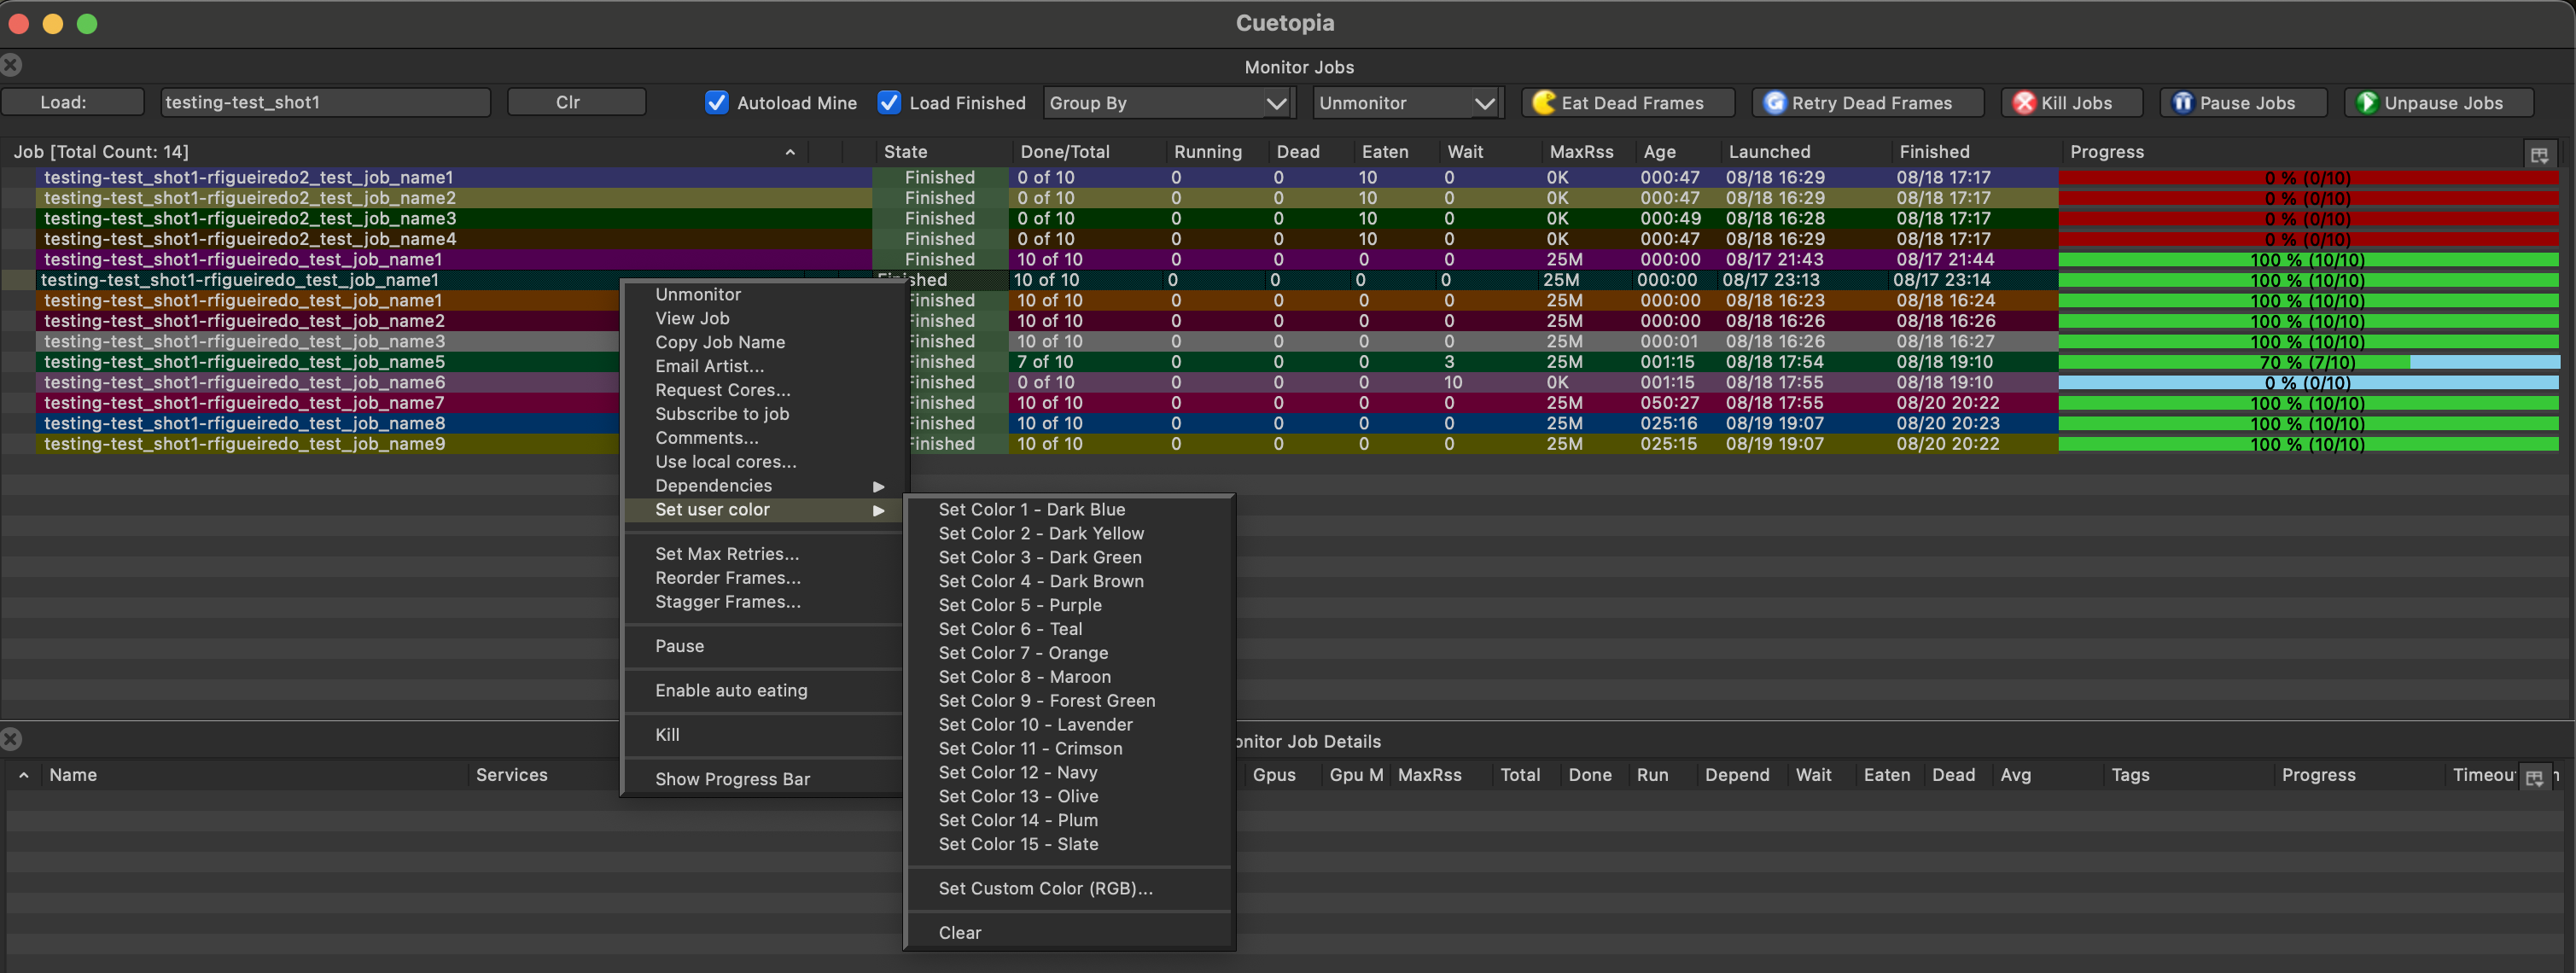
- Set user color (see Job Color Organization)
Job Color Organization
The Monitor Jobs view allows you to organize jobs visually by applying background colors. This feature is particularly useful when working with many concurrent renders, allowing you to group jobs by project, priority, department, or any other categorization scheme.
Jobs with assigned colors are also easily sortable using the User Color column, making it simple to find and group all jobs of a specific color.
Setting Job Colors
To apply a color to one or more jobs:
- Select Jobs: Click on a job or use Ctrl+click to select multiple jobs
- Right-Click: Open the context menu
- Choose Color: Navigate to “Set user color” submenu
Sorting by User Color
Click the User Color column header to sort jobs by their assigned colors. Click again to reverse the sort order. This allows you to quickly organize large job lists by color, making it easy to find jobs belonging to specific projects, priorities, or departments.
Available Color Options
The system provides 15 predefined colors with descriptive names:
- Set Color 1 - Dark Blue
- Set Color 2 - Dark Yellow
- Set Color 3 - Dark Green
- Set Color 4 - Dark Brown
- Set Color 5 - Purple
- Set Color 6 - Teal
- Set Color 7 - Orange
- Set Color 8 - Maroon
- Set Color 9 - Forest Green
- Set Color 10 - Lavender
- Set Color 11 - Crimson
- Set Color 12 - Navy
- Set Color 13 - Olive
- Set Color 14 - Plum
- Set Color 15 - Slate
Custom Color Option
For complete flexibility, use the “Set Custom Color (RGB)…“ option to create any color:
- Select jobs and choose “Set Custom Color (RGB)…” from the menu
- Enter RGB values (0-255 range) using the spinboxes
- Preview the color in real-time as you adjust values
- Click OK to apply the custom color
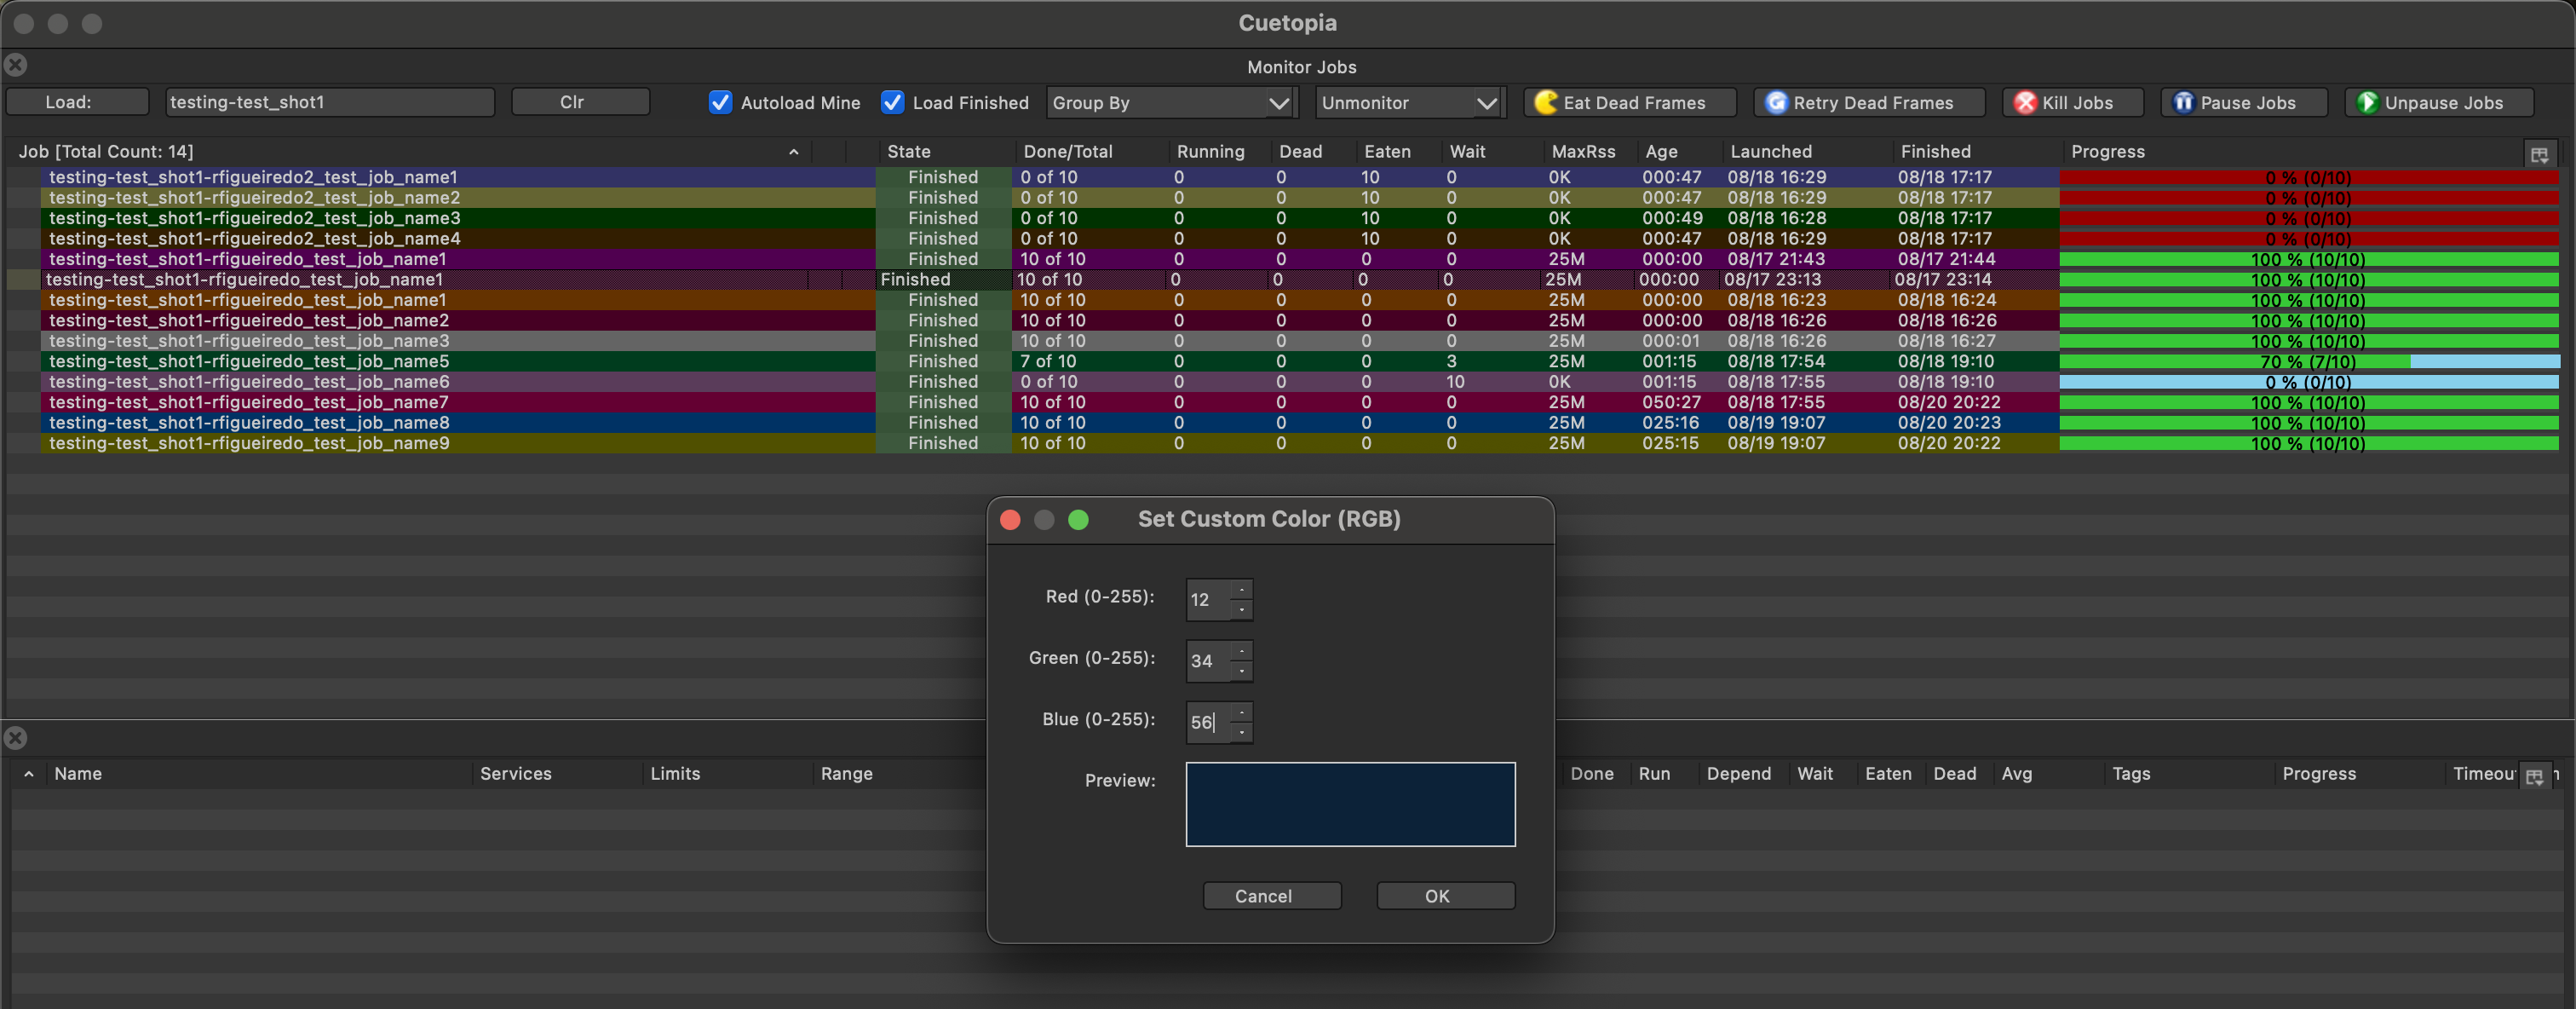
Note: Custom colors are displayed in the User Color column as “RGB(R,G,B)” format (e.g., “RGB(255,20,20)”), making it easy to identify and sort by custom color values. All jobs with the same custom RGB values will be grouped together when sorting by the User Color column.
Color Management
- Clear Colors: Use “Clear” option to remove color assignments
- Persistent Colors: Color assignments are saved and restored across CueGUI sessions
- Multiple Selection: Apply colors to multiple jobs simultaneously
- Visual Organization: Colors appear as background highlighting in the job list
Best Practices for Color Organization
- Consistent Scheme: Develop a facility-wide color coding standard
- Project-Based: Use different colors for different shows or projects
- Priority-Based: Use warmer colors (red, orange) for urgent jobs, cooler colors (blue, green) for routine work
- Department-Based: Assign colors by department (lighting, compositing, effects)
- Status-Based: Use colors to indicate job status or approval stages
Monitor Job Details Plugin
How to Open: Go to View/Plugins > Cuetopia > Monitor Job Details
The Monitor Job Details plugin provides detailed information about a selected job’s layers and frames. It can be opened manually from the menu or appears automatically when you double-click a job in the Monitor Jobs view.
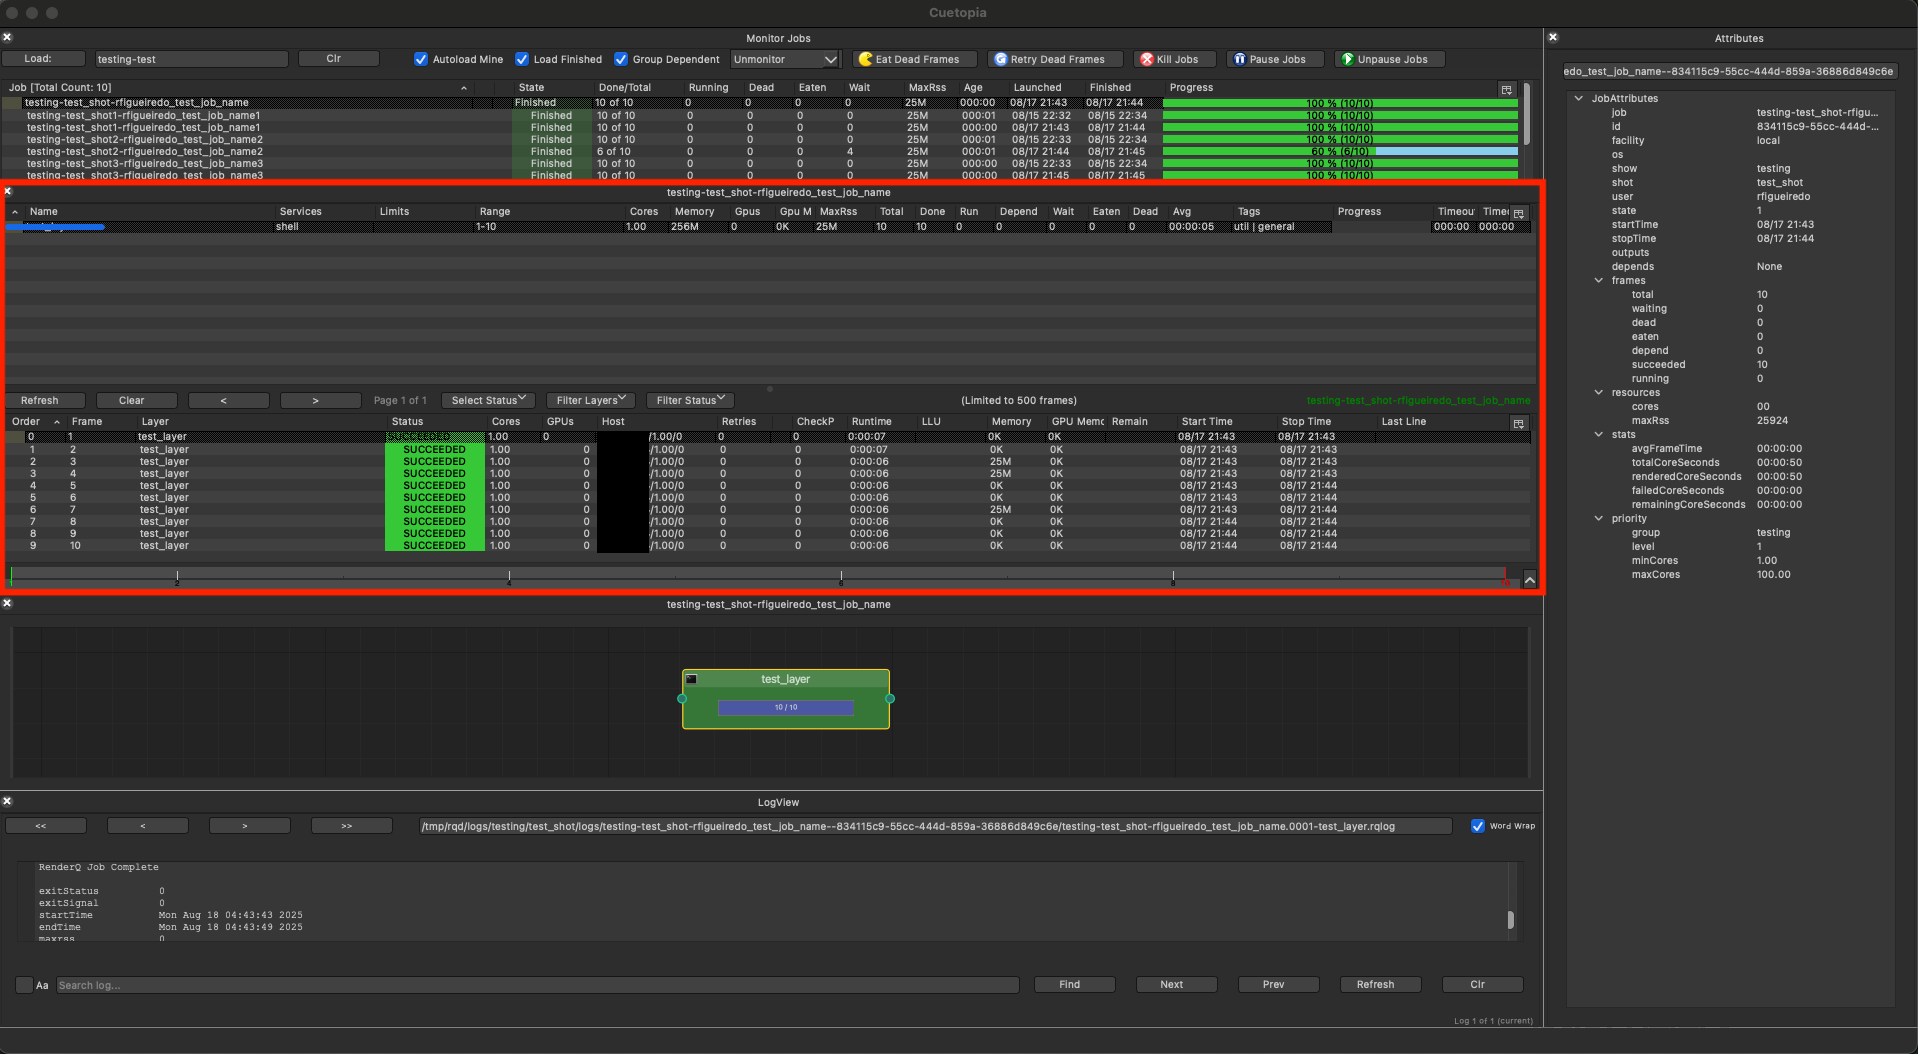
Layout Structure
The plugin uses a vertical splitter with two main sections:
Top Section: Layer Monitor
Displays all layers in the selected job with the following columns:
| Column | Description | Data Processing |
|---|---|---|
| Name | Layer name (e.g., test_layer) | Direct from layer.data.name |
| Services | Services/applications used (e.g., shell) | Comma-joined list |
| Limits | Applied resource limits | Comma-joined list |
| Range | Frame range (e.g., 1-10) | With chunking info if applicable |
| Cores | Core requirement | Shows “ALL” for 0, “ALL-n” for negative |
| Memory | Memory reservation | Formatted as human-readable (e.g., 256M) |
| Gpus | GPU requirement | Integer count |
| Gpu Memory | GPU memory reservation | Formatted as human-readable |
| MaxRss | Peak memory usage | Historical maximum |
| Total | Total frame count | From layer_stats.total_frames |
| Done | Completed frames | From layer_stats.succeeded_frames |
| Run | Running frames | From layer_stats.running_frames |
| Depend | Dependent frames | From layer_stats.depend_frames |
| Wait | Waiting frames | From layer_stats.waiting_frames |
| Eaten | Eaten frames | From layer_stats.eaten_frames |
| Dead | Dead frames | From layer_stats.dead_frames |
| Avg | Average frame time | Formatted as HH:MM:SS |
| Tags | Resource tags | Pipe-separated list |
| Progress | Visual progress bar | Percentage complete |
| Timeout | Frame timeout | In HH:MM format |
| Timeout LLU | Last log update timeout | In HH:MM format |
Bottom Section: Frame Monitor
Shows detailed frame information with filtering controls:
Control Bar (Top of Frame Section)
- Refresh Button: Manual refresh of frame list
- Clear Button: Clears all active filters
- Page Navigation:
- Previous (<) and Next (>) buttons
- Page counter (e.g., “Page 1 of 1”)
- Limited to 500 frames per page
- Select Status Dropdown: Quick selection by frame state
- Filter Layers Dropdown: Filter frames by specific layers
- Filter Status Dropdown: Filter by frame status
Frame Table Columns
| Column | Description | Special Handling |
|---|---|---|
| Order | Dispatch order within layer | Sort priority |
| Frame | Frame number | Integer display |
| Layer | Parent layer name | Links to layer |
| Status | Frame state (SUCCEEDED, RUNNING, etc.) | Color-coded |
| Cores | Cores used/reserved | Decimal for running frames |
| GPUs | GPUs used | Integer count |
| Host | Current/last host | Hostname or “0K” if none |
| Retries | Retry count | Cumulative |
| CheckP | Checkpoint count | For resumable frames |
| Runtime | Frame runtime | HH:MM:SS format |
| LLU | Last log update | Time since last log write |
| Memory | Memory usage | Current if running, peak if not |
| GPU Mem | GPU memory usage | Current if running, peak if not |
| Remain | Estimated time remaining | Based on historical data |
| Start Time | Frame start timestamp | MM/DD HH:MM |
| Stop Time | Frame completion timestamp | MM/DD HH:MM |
| Last Line | Last log line | Truncated to fit |
Frame Status Color Coding
Frames are color-coded by status:
- 🟢 Green: SUCCEEDED
- 🟡 Yellow: RUNNING
- 🔵 Blue: WAITING
- 🟣 Purple: DEPEND
- 🔴 Red: DEAD
- ⚫ Gray: EATEN
Job Graph Plugin
How to Open: Go to View/Plugins > Cuetopia > Job Graph
The Job Graph plugin provides a visual node-based representation of job layers and their dependencies.
Graph Features
Node Representation
Each layer is displayed as a node with:
- Node Color: Reflects layer state
- 🟢 Green: All frames completed
- 🟡 Yellow: Frames running
- 🔴 Red: Has dead frames
- 🔵 Blue: Waiting for resources
- 🟣 Purple: Waiting on dependencies
- ⚫ Gray: Dependent on other layers
- Node Information:
- Layer name
- Frame count (done/total)
- Running count
- Progress bar
Dependency Connections
- Arrows: Show dependency flow
- Direction: Parent -> Child relationships
- Line Style: Solid for active dependencies
Interaction
- Selection: Click to select layers
- Multi-select: Ctrl+click for multiple
- Pan: Middle-mouse drag
- Zoom: Mouse wheel
- Auto-layout: Automatically arranges nodes
Context Menu
Right-click on nodes provides:
- View/modify dependencies
- Layer properties
- Frame management actions
- Resource allocation
CueProgBar - Progress Bar Window
CueProgBar is a lightweight, standalone progress monitoring window that provides a visual representation of job frame status. It offers a minimalist interface for quick job monitoring without the overhead of the full CueGUI application.
Launching CueProgBar
From CueGUI Job Context Menu:
- Right-click on any job in the Monitor Jobs view
- Select “Show Progress Bar” from the context menu
- A separate progress bar window opens for that job
Interface Overview
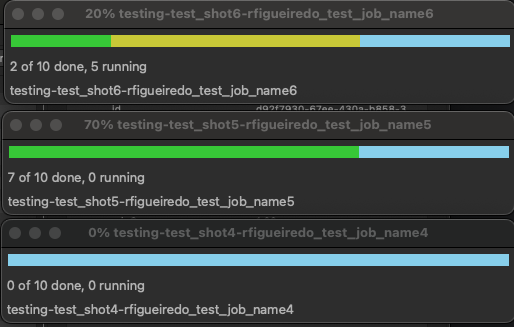
The CueProgBar window consists of three main components:
- Visual Progress Bar: A horizontal bar showing frame states through color coding
- Status Label: Displays current progress (e.g., “150 of 200 done, 10 running”)
- Job Name Label: Shows the full job name
Frame State Color Coding
The progress bar uses distinct colors to represent different frame states:
| State | Color | Description |
|---|---|---|
| SUCCEEDED | Green (#37C837) | Frames that completed successfully |
| RUNNING | Yellow (#C8C837) | Frames currently being processed |
| WAITING | Light Blue (#87CFEB) | Frames ready to run when resources are available |
| DEPEND | Purple (#A020F0) | Frames waiting on dependencies |
| DEAD | Red (#FF0000) | Frames that failed and exceeded retry attempts |
| EATEN | Dark Red (#960000) | Frames manually marked as complete |

Interactive Features
Left-Click Menu
Clicking the left mouse button on the progress bar displays a breakdown of frame states:
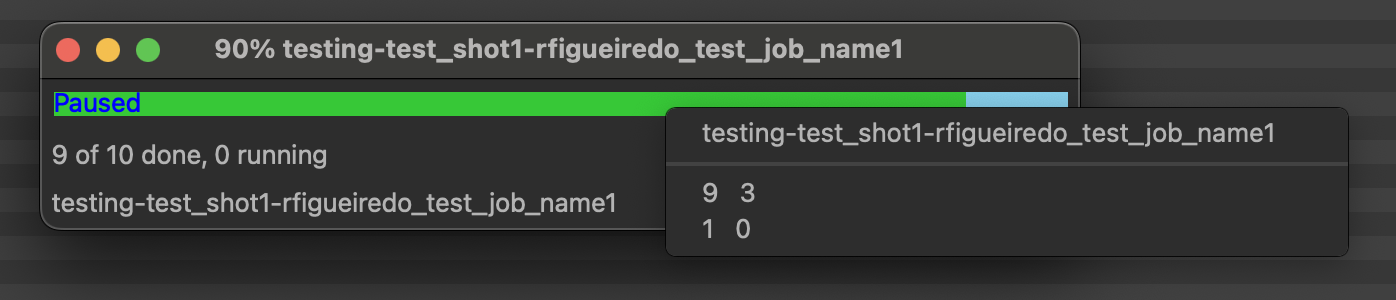
- Shows count for each frame state
- Color-coded icons match the progress bar colors
- Only displays states with non-zero counts
Right-Click Context Menu
Right-clicking the progress bar reveals job control actions:
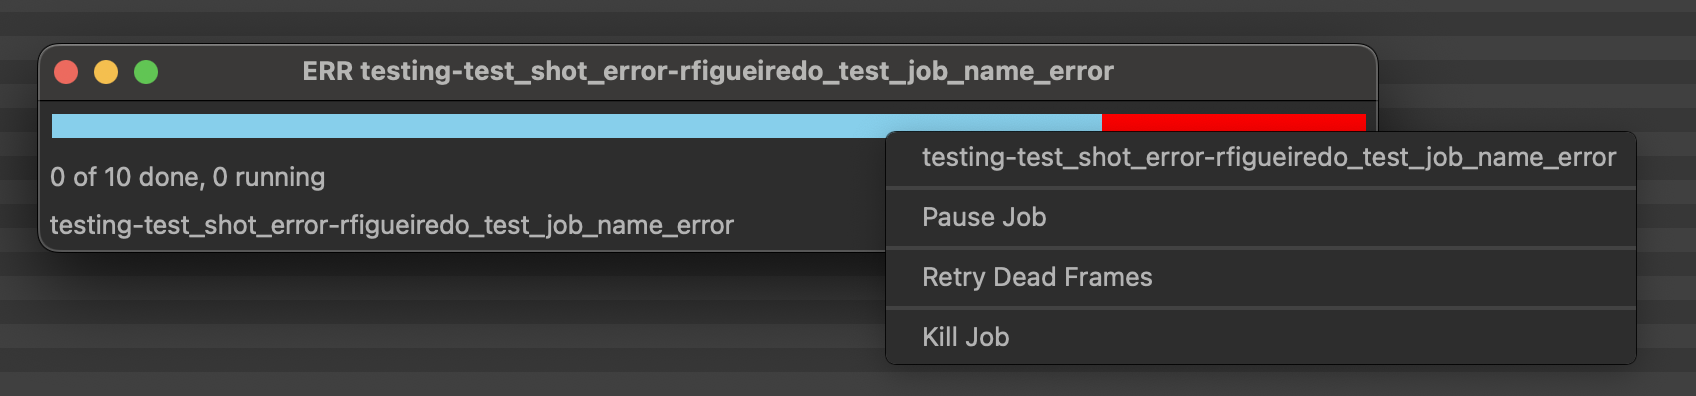
Available actions include:
- Pause/Unpause Job:
- Toggles job execution state
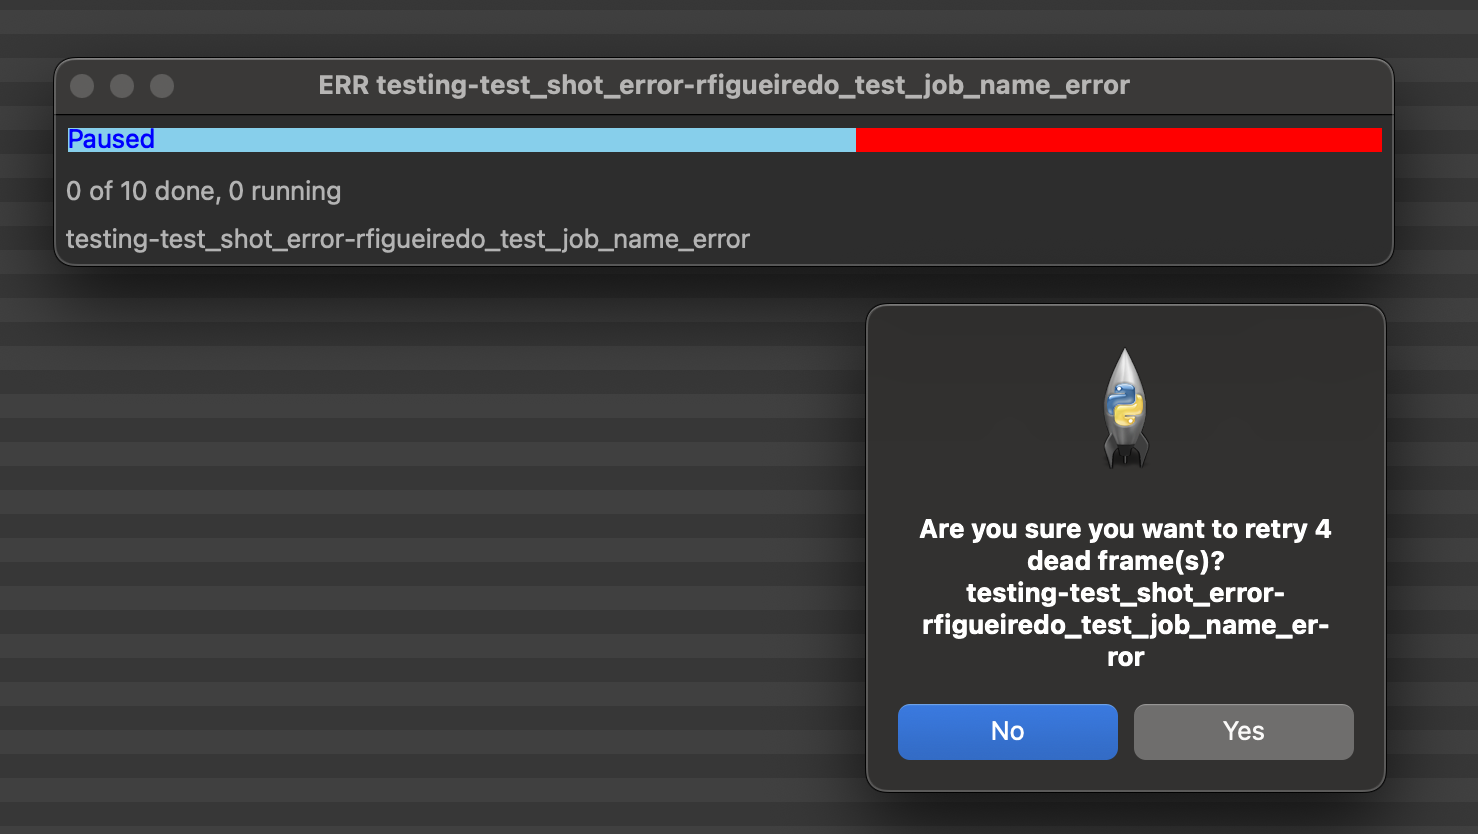
- Paused jobs show “Paused” overlay on the progress bar
- Prevents new frames from starting while allowing running frames to complete
- Retry Dead Frames (NEW):
- Appears only when dead frames exist
- Shows confirmation dialog with dead frame count
- Retries all frames in DEAD state
- Displays success/failure notification
- Kill Job:
- Terminates the job and all running frames
- Requires confirmation dialog
- Logs the action with username and timestamp
Window Features
Auto-Update
- Refreshes every 5 seconds (configurable)
- Updates frame counts and progress bar in real-time
- Stops updating when job completes
Window Title
The window title dynamically updates to show:
- Percentage: “75% job_name” (for running jobs)
- DONE: “DONE job_name” (for completed jobs)
- ERR: “ERR job_name” (when dead frames exist and no frames are running)
Visual Indicators
- COMPLETE overlay: Displayed when job finishes successfully
- Paused overlay: Shown when job is paused
- Job Not Found message: Appears if job is deleted or becomes inaccessible
Use Cases
CueProgBar is ideal for:
- Quick Monitoring: Artists who want to monitor specific jobs without full CueGUI
- Multi-Job Tracking: Opening multiple progress bars for different jobs simultaneously
- Desktop Integration: Minimal windows that can be arranged on secondary monitors
- Resource Efficiency: Lower memory and CPU usage compared to full CueGUI
Technical Details
Memory Usage
- Minimal memory footprint
- No layer or frame detail caching
- Simple RPC calls for job statistics only
Update Mechanism
# Update cycle (every 5 seconds)
1. Fetch job statistics via RPC
2. Calculate frame state totals
3. Repaint progress bar
4. Update labels and title
Best Practices
- Multiple Windows: Open separate progress bars for critical jobs
- Window Arrangement: Stack vertically for space-efficient monitoring
- Close When Done: Windows can be safely closed without affecting jobs
- Retry Strategy: Use “Retry Dead Frames” before marking jobs complete
Filters and Search Capabilities
Job Search Patterns
The search field supports multiple pattern types:
- Direct Job Name:
testing-test_shot-username_test_job_name - Show-Shot Pattern:
testing-test_shot - Username:
username(loads all user’s jobs) - Regular Expression:
test.*shot.* - Job UUID:
Job.f156be87-987a-48b9-b9da-774cd58674a3
Frame Filtering
Status Filters
- SUCCEEDED: Completed frames
- RUNNING: Currently executing
- WAITING: Ready to run
- DEPEND: Waiting on dependencies
- DEAD: Failed frames
- EATEN: Manually marked complete
Layer Filters
- Single layer selection
- Multiple layer selection (Ctrl+click)
- Applied via dropdown or double-click
Range Selection
- Visual slider at bottom of frame monitor
- Click and drag to select range
- Updates frame display in real-time
Filter Combination
Filters are applied cumulatively:
- Layer filter (if set)
- Status filter (if set)
- Range filter (if set)
- Results limited to 500 frames
Data Processing and Updates
Update Mechanisms
Automatic Updates
- Job Monitor: 10-second refresh cycle
- Layer Monitor: Updates with job selection
- Frame Monitor: Updates on layer changes
- Job Graph: 20-second refresh cycle
Manual Updates
- Refresh button (available in each view)
- Updates on user actions
- Forced refresh on filter changes
RPC Call Optimization
Each field update involves specific RPC calls to Cuebot:
- Job Data: Single
getJob()call retrieves:- Basic job properties
- Job statistics
- State information
- Layer Data:
getLayers()call fetches:- All layers for a job
- Layer statistics
- Resource requirements
- Frame Data:
getFrames()with search criteria:- Paginated results (500 frame limit)
- Filtered by status/layer
- Includes runtime statistics
Performance Considerations
Caching Strategy
- Job list cached for session
- Layer data refreshed on job change
- Frame data paginated for performance
- Log data cached for 15 seconds
Memory Management
- Finished jobs removed after 3 days
- Maximum 200 jobs restored on startup
- Weak references prevent memory leaks
- Virtual scrolling for large lists
Data Flow Architecture
User Action → CueGUI Widget → RPC Client → Cuebot Server → Database
                ↓                              ↓
           Local Cache ← ← ← ← ← ← ← Response Data
                ↓
           UI Update → Signal Emission → Connected Widgets Update
Error Handling
- Connection Loss: Graceful degradation with cached data
- RPC Failures: Automatic retry with exponential backoff
- Invalid Data: Validation and sanitization at widget level
- Performance Issues: Pagination and lazy loading
Best Practices
Efficient Monitoring
- Use filters to reduce data volume
- Group dependent jobs for cleaner display
- Close unused detail views to reduce updates
- Limit frame monitor to relevant layers
Troubleshooting Tips
- Slow updates: Check network connection to Cuebot
- Missing jobs: Verify within 3-day threshold
- Filter issues: Use Clear button to reset
- Graph layout: Use auto-layout to reorganize
Mouse and Keyboard Interactions
- Space: Trigger updates across all views
- Ctrl+Click: Multi-select items in lists and tables
- Double-click: Open job details, frame logs, or other detailed views
Advanced Features
Custom Column Configuration
Users can customize displayed columns:
- Right-click column headers
- Select columns to show/hide
- Drag to reorder columns
- Resize by dragging borders
Settings Persistence
CueGUI saves user preferences:
- Column configurations
- Filter settings
- Window layouts
- Search history
- Job monitoring list
Settings stored in: ~/.config/opencue/cuegui.ini
Job Interaction Permissions
CueGUI includes a permission system that controls which jobs users can modify. This is particularly important in production environments where artists should generally only manage their own jobs, but administrators and show TDs need the ability to retry or modify jobs across all users.
Permission Model
By default, users can only perform certain actions (kill, retry dead frames, auto-eating) on jobs they own. To manage jobs owned by other users, you must enable Job Interaction mode.
Default Behavior (Job Interaction Disabled):
- Can only modify jobs you own (matching your username)
- Actions on other users’ jobs will be blocked with a permission error
- Provides safety against accidentally modifying others’ work
Job Interaction Enabled:
- Can modify any job regardless of owner
- Intended for administrators, Production Services and Resources (PSR) teams, and Developers
- Should be used with caution
Protected Actions
The following actions require ownership or enabled Job Interaction:
- Kill Jobs: Terminate jobs and running frames
- Retry Dead Frames: Retry all frames that failed
- Auto Eating (Enable/Disable): Toggle automatic eating of dead frames
- Eat Dead Frames: Mark dead frames as complete
- Layer Operations: Retry layers, modify layer settings
- Frame Operations: Retry specific frames
Note: Pause and Resume operations are NOT protected and can be performed on any job.
Enabling/Disabling Job Interaction
To enable or disable Job Interaction:
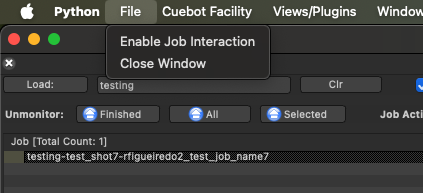
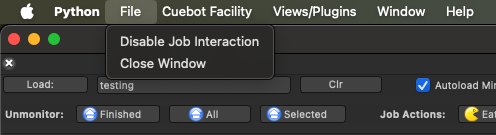
- Open the File menu in CueGUI (either Cuetopia or CueCommander)
- Select either:
- Enable Job Interaction (if currently disabled)
- Disable Job Interaction (if currently enabled)
- Confirm the restart prompt
- CueGUI will close and must be restarted for the change to take effect
- Enable Job Interaction
- Disable Job Interaction
The setting is persistent across sessions and stored in your user preferences.
When to Enable Job Interaction
Enable Job Interaction when:
- You are part of the Pipeline team, Production Services and Resources (PSR) team, system administrator performing daily maintenance
- Retrying jobs across multiple users is part of your workflow
- Providing production support for render issues
- Managing jobs during off-hours or emergencies
Keep Job Interaction Disabled when:
- Working as an artist managing only your own jobs
- Safety and preventing accidental modifications is a priority
- You don’t regularly need to manage others’ jobs
Permission Error Messages
If you attempt an action on someone else’s job without Job Interaction enabled, you’ll see an error message like:
You do not have permissions to retry dead for some of the selected jobs owned by <USERNAME>

Job actions can still be enabled at File > Enable Job Interaction, but caution is advised.
This message confirms the action was blocked and reminds you how to enable permissions if needed.
Best Practices
- Enable Only When Needed: Keep Job Interaction disabled during normal artist/end-user work
- Communicate: Inform job owners when modifying their jobs
- Document Changes: Note why jobs were killed or retried for tracking
- Verify Ownership: Double-check job names before performing destructive actions
Plugin Integration
Cuetopia plugins integrate with other CueGUI components:
- Log Viewer: Double-click frames to view logs
- Host Monitor: View hosts running frames
- Dependency Editor: Modify job dependencies
- Local Booking: Allocate local resources