Render farm monitoring guide
Configure and use the OpenCue render farm monitoring system
This guide explains how to use the OpenCue monitoring system to track render farm operations, create custom dashboards, and set up alerts.
Overview
The OpenCue monitoring system provides three ways to observe your render farm:
- Real-time metrics via Prometheus and Grafana
- Event streaming via Kafka
- Historical analysis via Elasticsearch and Kibana
Monitoring stack components
| Component | Purpose | URL |
|---|---|---|
| Grafana | Dashboards and visualization | http://localhost:3000 |
| Prometheus | Metrics collection | http://localhost:9090 |
| Kafka UI | Event stream browser | http://localhost:8090 |
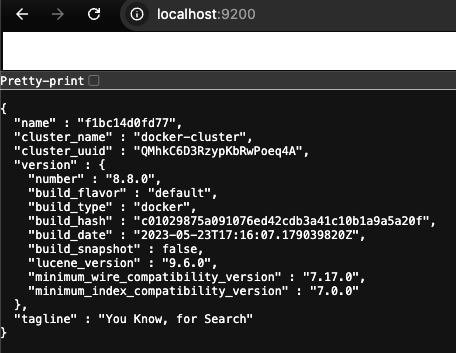
| Elasticsearch | Historical data storage | http://localhost:9200 |
| Kibana | Elasticsearch visualization | http://localhost:5601 |
| Kafka | Event streaming (internal) | localhost:9092 |
| monitoring-indexer | Kafka to Elasticsearch indexer (Rust) | - |
| Zookeeper | Kafka coordination (internal) | localhost:2181 |
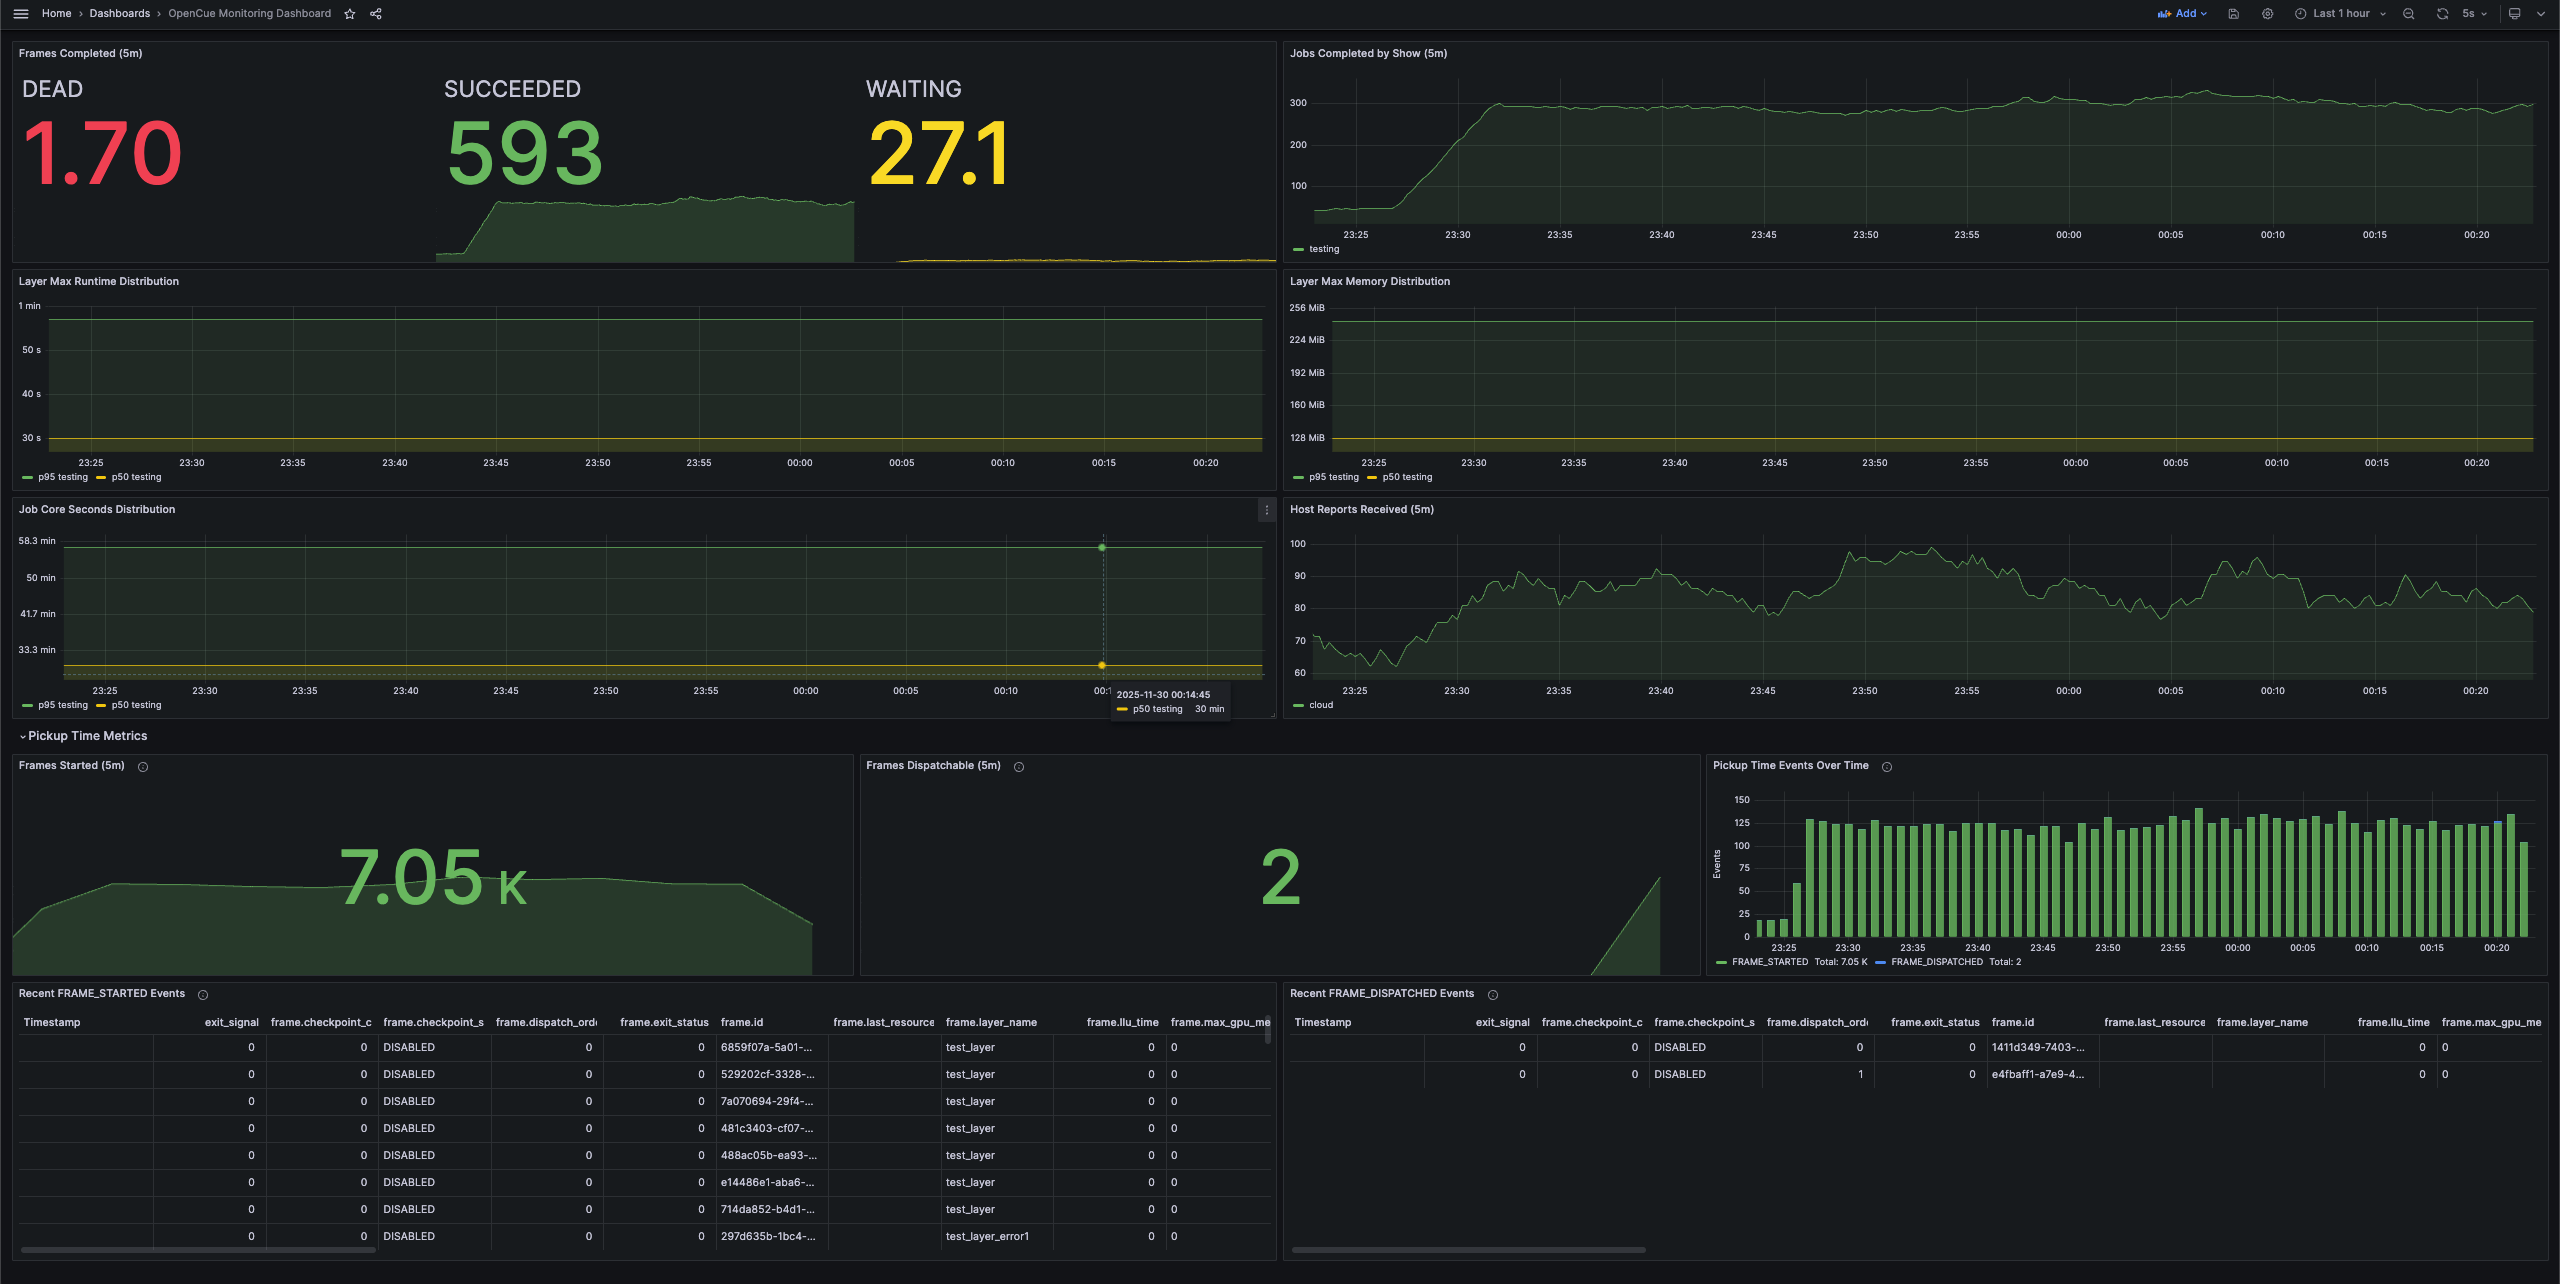
Grafana: OpenCue Monitoring Grafana Dashboard
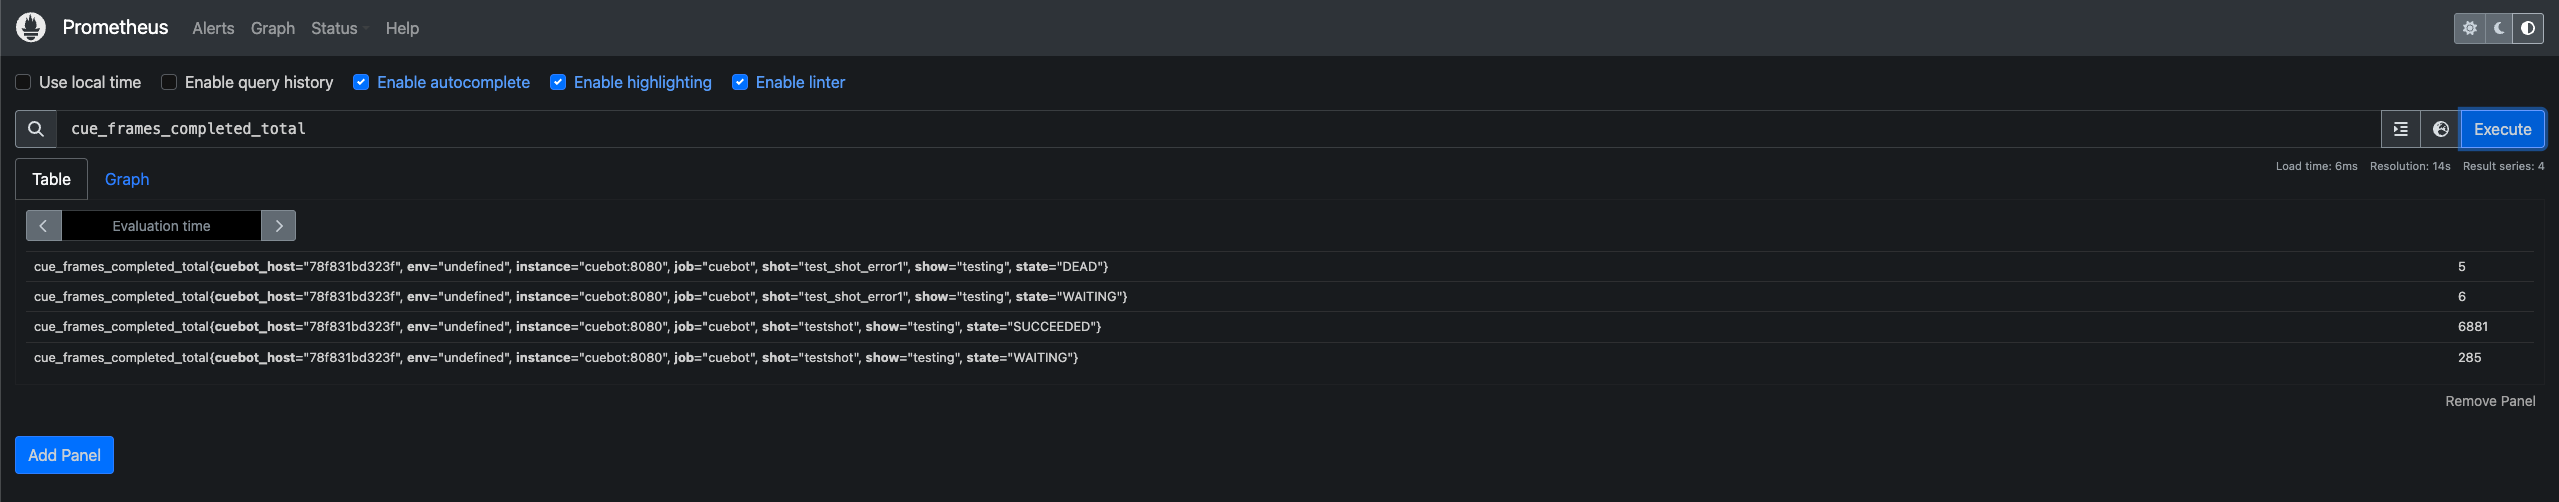
Prometheus Metrics Interface
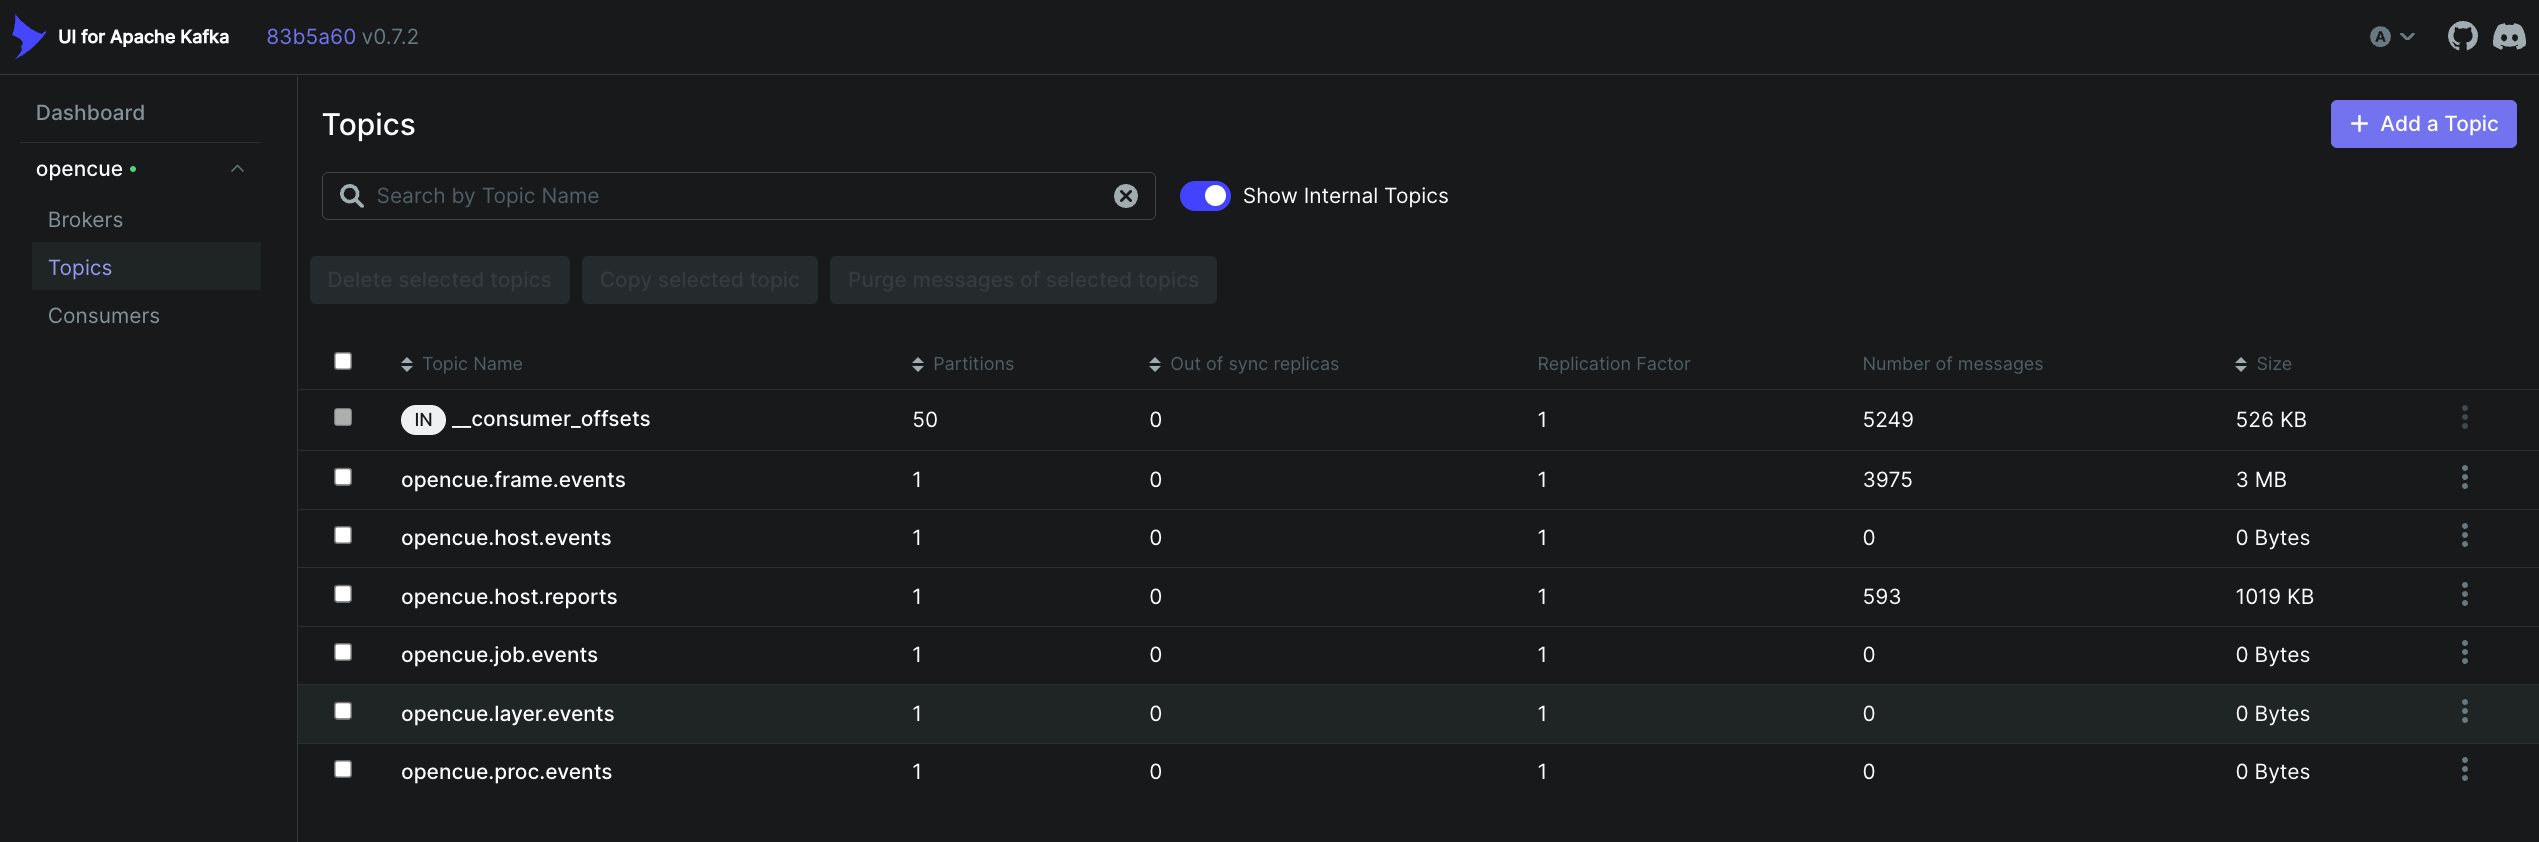
UI for Apache Kafka
Elasticsearch Kibana - Dev Tools
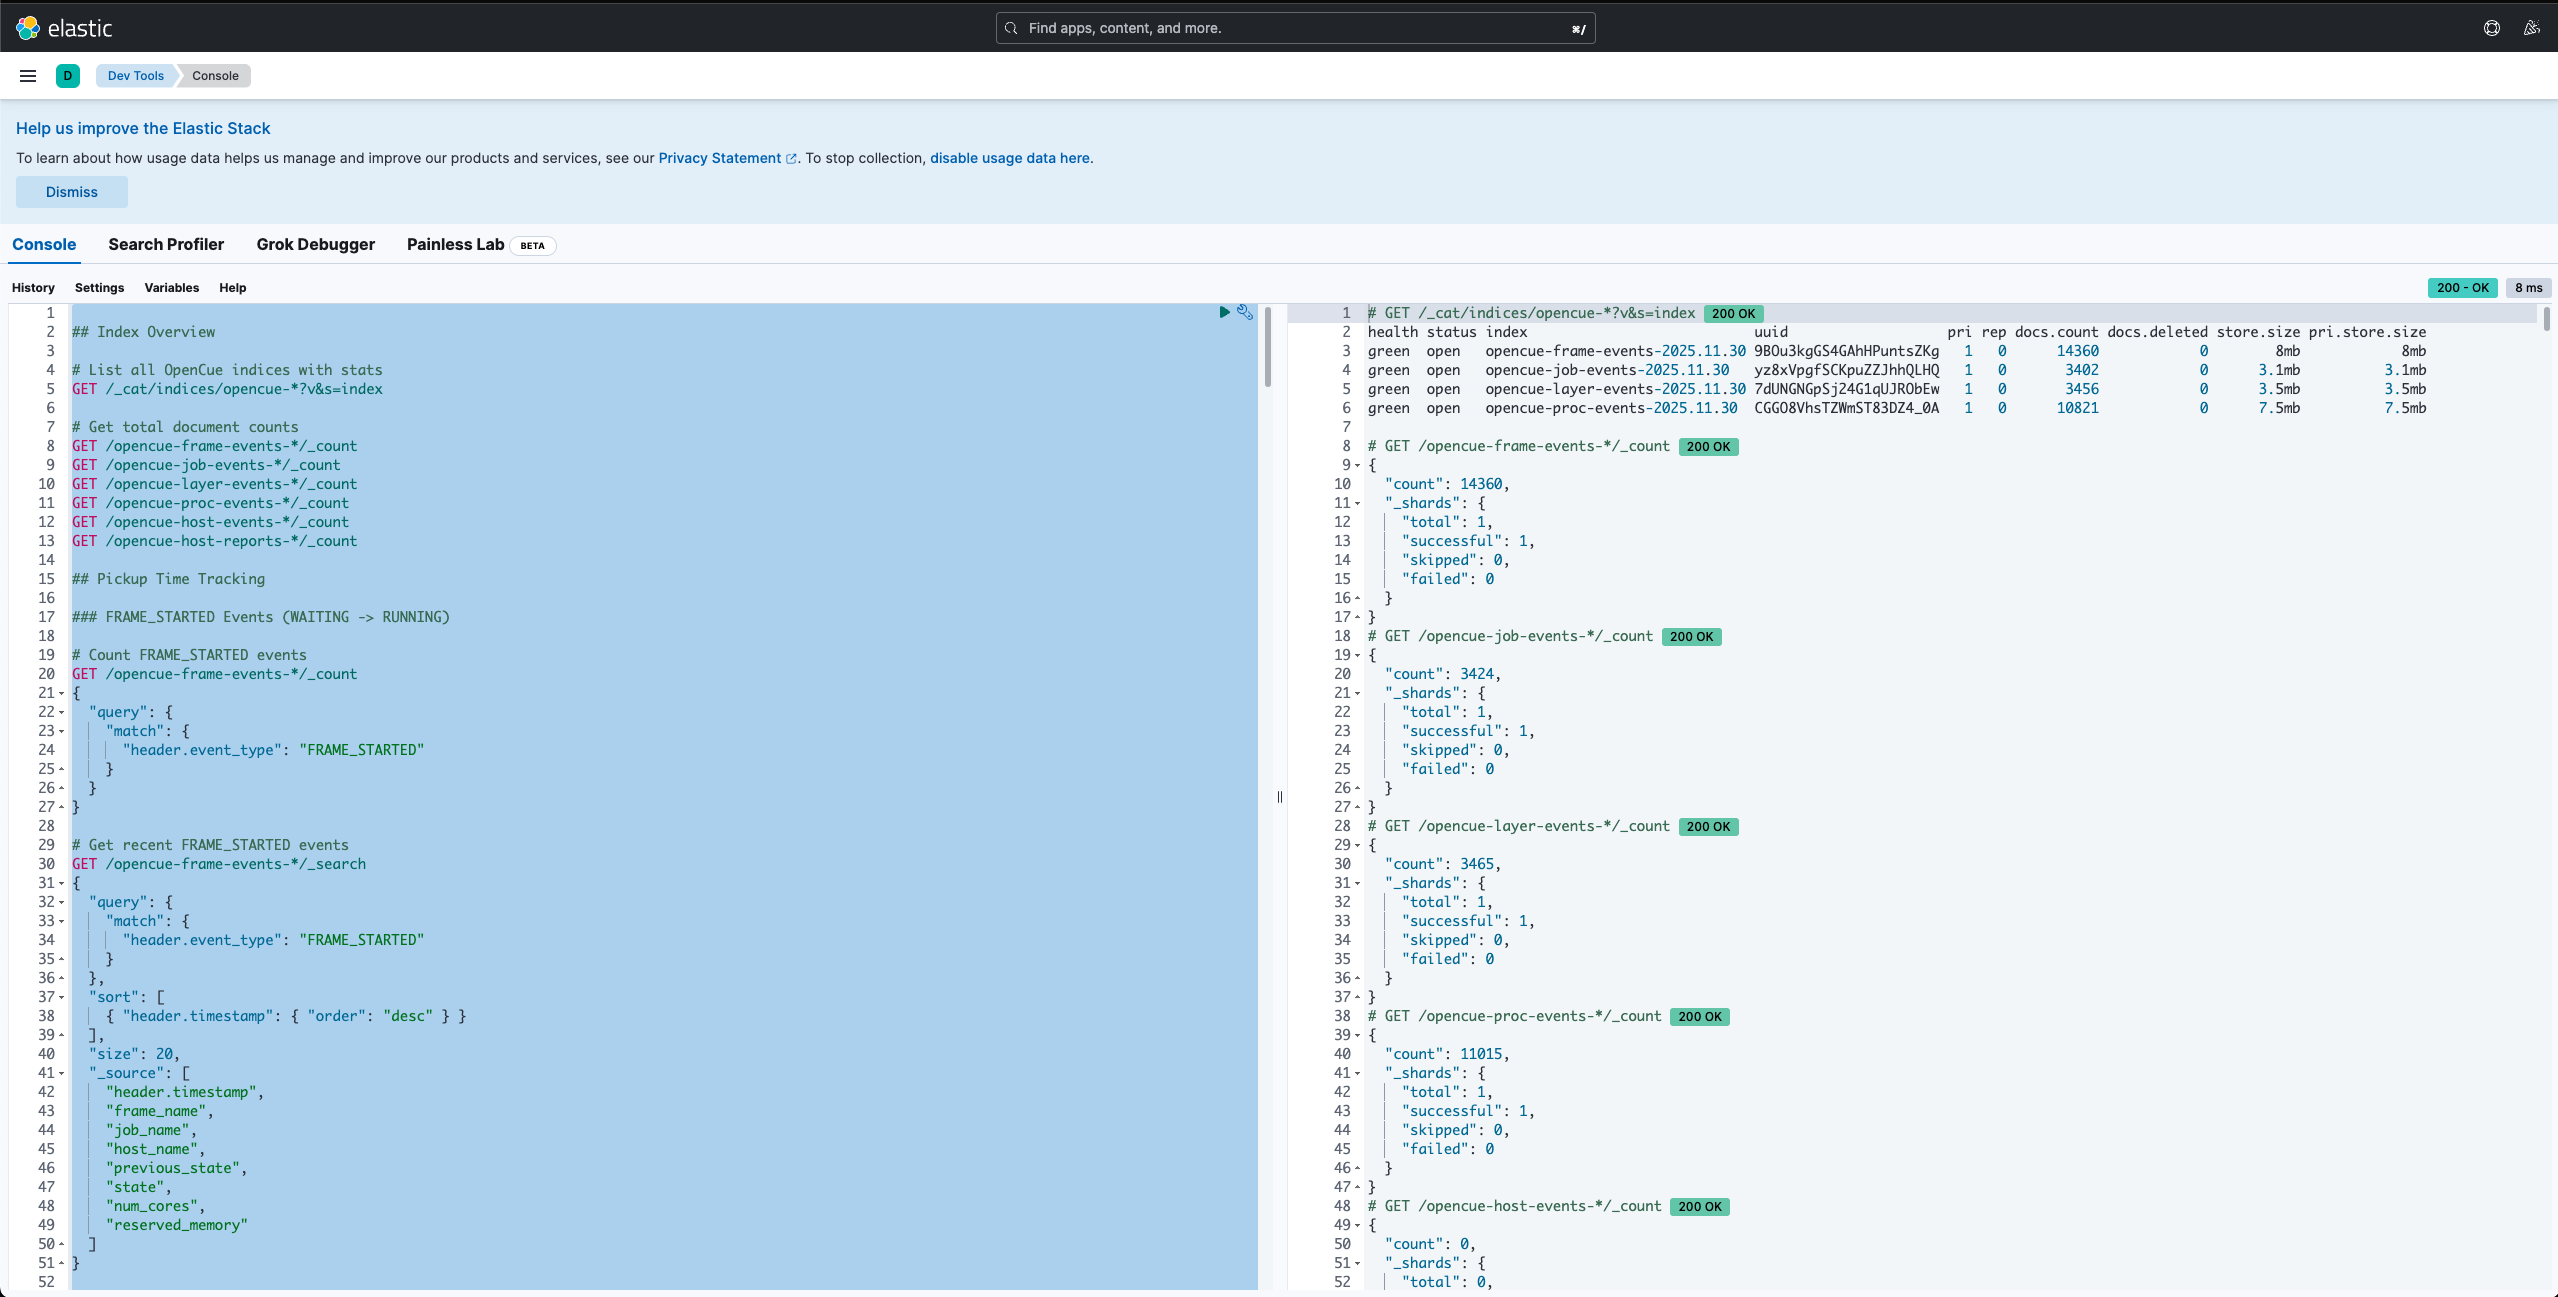
Elasticsearch
Configuring Cuebot for monitoring
Enabling Kafka event publishing
Add these properties to your Cuebot configuration:
# Enable Kafka event publishing
monitoring.kafka.enabled=true
monitoring.kafka.bootstrap.servers=your-kafka-host:9092

# Optional: Configure event queue
monitoring.kafka.queue.capacity=1000
monitoring.kafka.batch.size=100
Or pass them as command-line arguments:
java -jar cuebot.jar \
  --monitoring.kafka.enabled=true \
  --monitoring.kafka.bootstrap.servers=kafka:9092
Enabling Elasticsearch storage
Elasticsearch indexing is handled by the standalone monitoring-indexer service (located in rust/crates/monitoring-indexer/), not Cuebot. The indexer consumes events from Kafka and bulk indexes them into Elasticsearch.
Using environment variables:
export KAFKA_BOOTSTRAP_SERVERS=kafka:9092
export ELASTICSEARCH_URL=http://elasticsearch:9200
monitoring-indexer
Or using CLI arguments:
monitoring-indexer \
  --kafka-servers kafka:9092 \
  --elasticsearch-url http://elasticsearch:9200 \
  --index-prefix opencue
Enabling Prometheus metrics
# Enable Prometheus metrics endpoint
metrics.prometheus.collector=true
The metrics endpoint is available at http://cuebot-host:8080/metrics.
Using Grafana dashboards
Accessing the dashboard
- Open Grafana at your configured URL (default:
http://localhost:3000) - Navigate to Dashboards > OpenCue Monitoring Dashboard
Dashboard panels
The pre-configured dashboard includes:
Frame metrics
| Panel | Description | Metric |
|---|---|---|
| Frames Completed (5m) | Frames completed in 5 minutes by state | increase(cue_frames_completed_total[5m]) |
| Frame Runtime Distribution | P50 and P95 frame execution times | histogram_quantile(0.95, cue_frame_runtime_seconds_bucket) |
| Frame Memory Usage Distribution | Memory consumption distribution | histogram_quantile(0.95, cue_frame_memory_bytes_bucket) |
Job metrics
| Panel | Description | Metric |
|---|---|---|
| Jobs Completed by Show (5m) | Jobs completed per show in 5 minutes | increase(cue_jobs_completed_total[5m]) |
System health
| Panel | Description | Metric |
|---|---|---|
| Host Reports Received (5m) | Reports received from render hosts | increase(cue_host_reports_received_total[5m]) |
Creating custom panels
To create a custom panel:
- Click Add > Visualization
- Select Prometheus as the data source
- Enter your PromQL query
- Configure visualization options
Example queries:
# Average frame runtime by show (last hour)
avg(rate(cue_frame_runtime_seconds_sum[1h])) by (show)
  / avg(rate(cue_frame_runtime_seconds_count[1h])) by (show)

# Failed frame rate
rate(cue_frames_completed_total{state="DEAD"}[5m])

# Queue saturation
cue_dispatch_waiting_total / cue_dispatch_remaining_capacity_total
Setting up alerts
To create an alert in Grafana:
- Edit a panel or create a new one
- Click the Alert tab
- Configure alert conditions
Example alert: High frame failure rate
Alert name: High Frame Failure Rate
Condition: rate(cue_frames_completed_total{state="DEAD"}[5m]) > 0.1
For: 5m
Message: "Frame failure rate is elevated. Check job configurations and host health."
Example alert: Cuebot down
Alert name: Cuebot Down
Condition: up{job="cuebot"} == 0
For: 1m
Message: "Cuebot is not responding to Prometheus scrapes."
Using Kafka for event streaming
Viewing events
Use the Kafka console consumer to view events:
# View job events
kafka-console-consumer --bootstrap-server kafka:9092 \
  --topic opencue.job.events --from-beginning

# View frame events (latest only)
kafka-console-consumer --bootstrap-server kafka:9092 \
  --topic opencue.frame.events
Event format
Events are published as JSON messages with a header containing metadata and fields at the top level:
{
  "header": {
    "event_id": "f533d84a-1586-4980-8c5e-3443376425c9",
    "event_type": "FRAME_COMPLETED",
    "timestamp": "1764097486229",
    "source_cuebot": "cuebot-01",
    "correlation_id": "fa7bbb9a-cae1-4f6b-a50a-88a9ac349d24"
  },
  "frame_id": "fa18c460-0e92-49e1-8d6a-e26473ac2708",
  "frame_name": "0001-render",
  "frame_number": 1,
  "layer_id": "53ec9034-b16b-4cc2-9eec-05f68b1848bf",
  "layer_name": "render",
  "job_id": "fa7bbb9a-cae1-4f6b-a50a-88a9ac349d24",
  "job_name": "show-shot-user_render",
  "show": "show",
  "state": "SUCCEEDED",
  "previous_state": "RUNNING",
  "exit_status": 0,
  "run_time": 3600,
  "max_rss": "8589934592",
  "host_name": "render-node-01",
  "num_cores": 8,
  "num_gpus": 0
}
Integrating with external systems
Kafka events can be consumed by external systems for:
- Custom alerting: Build alerts based on specific job or frame conditions
- Cost tracking: Calculate render costs based on resource usage
- Capacity planning: Analyze usage patterns for infrastructure planning
- Reporting: Generate custom reports on render farm utilization
Example Python consumer:
from kafka import KafkaConsumer
import json

# Note: lz4 library required for decompression (pip install kafka-python lz4)
consumer = KafkaConsumer(
    'opencue.frame.events',
    bootstrap_servers=['kafka:9092'],
    value_deserializer=lambda m: json.loads(m.decode('utf-8'))
)

for message in consumer:
    event = message.value
    header = event.get('header', {})
    if header.get('event_type') == 'FRAME_FAILED':
        print(f"Frame failed: {event.get('frame_name')}")
        # Send alert, update database, etc.
Using Elasticsearch for historical analysis
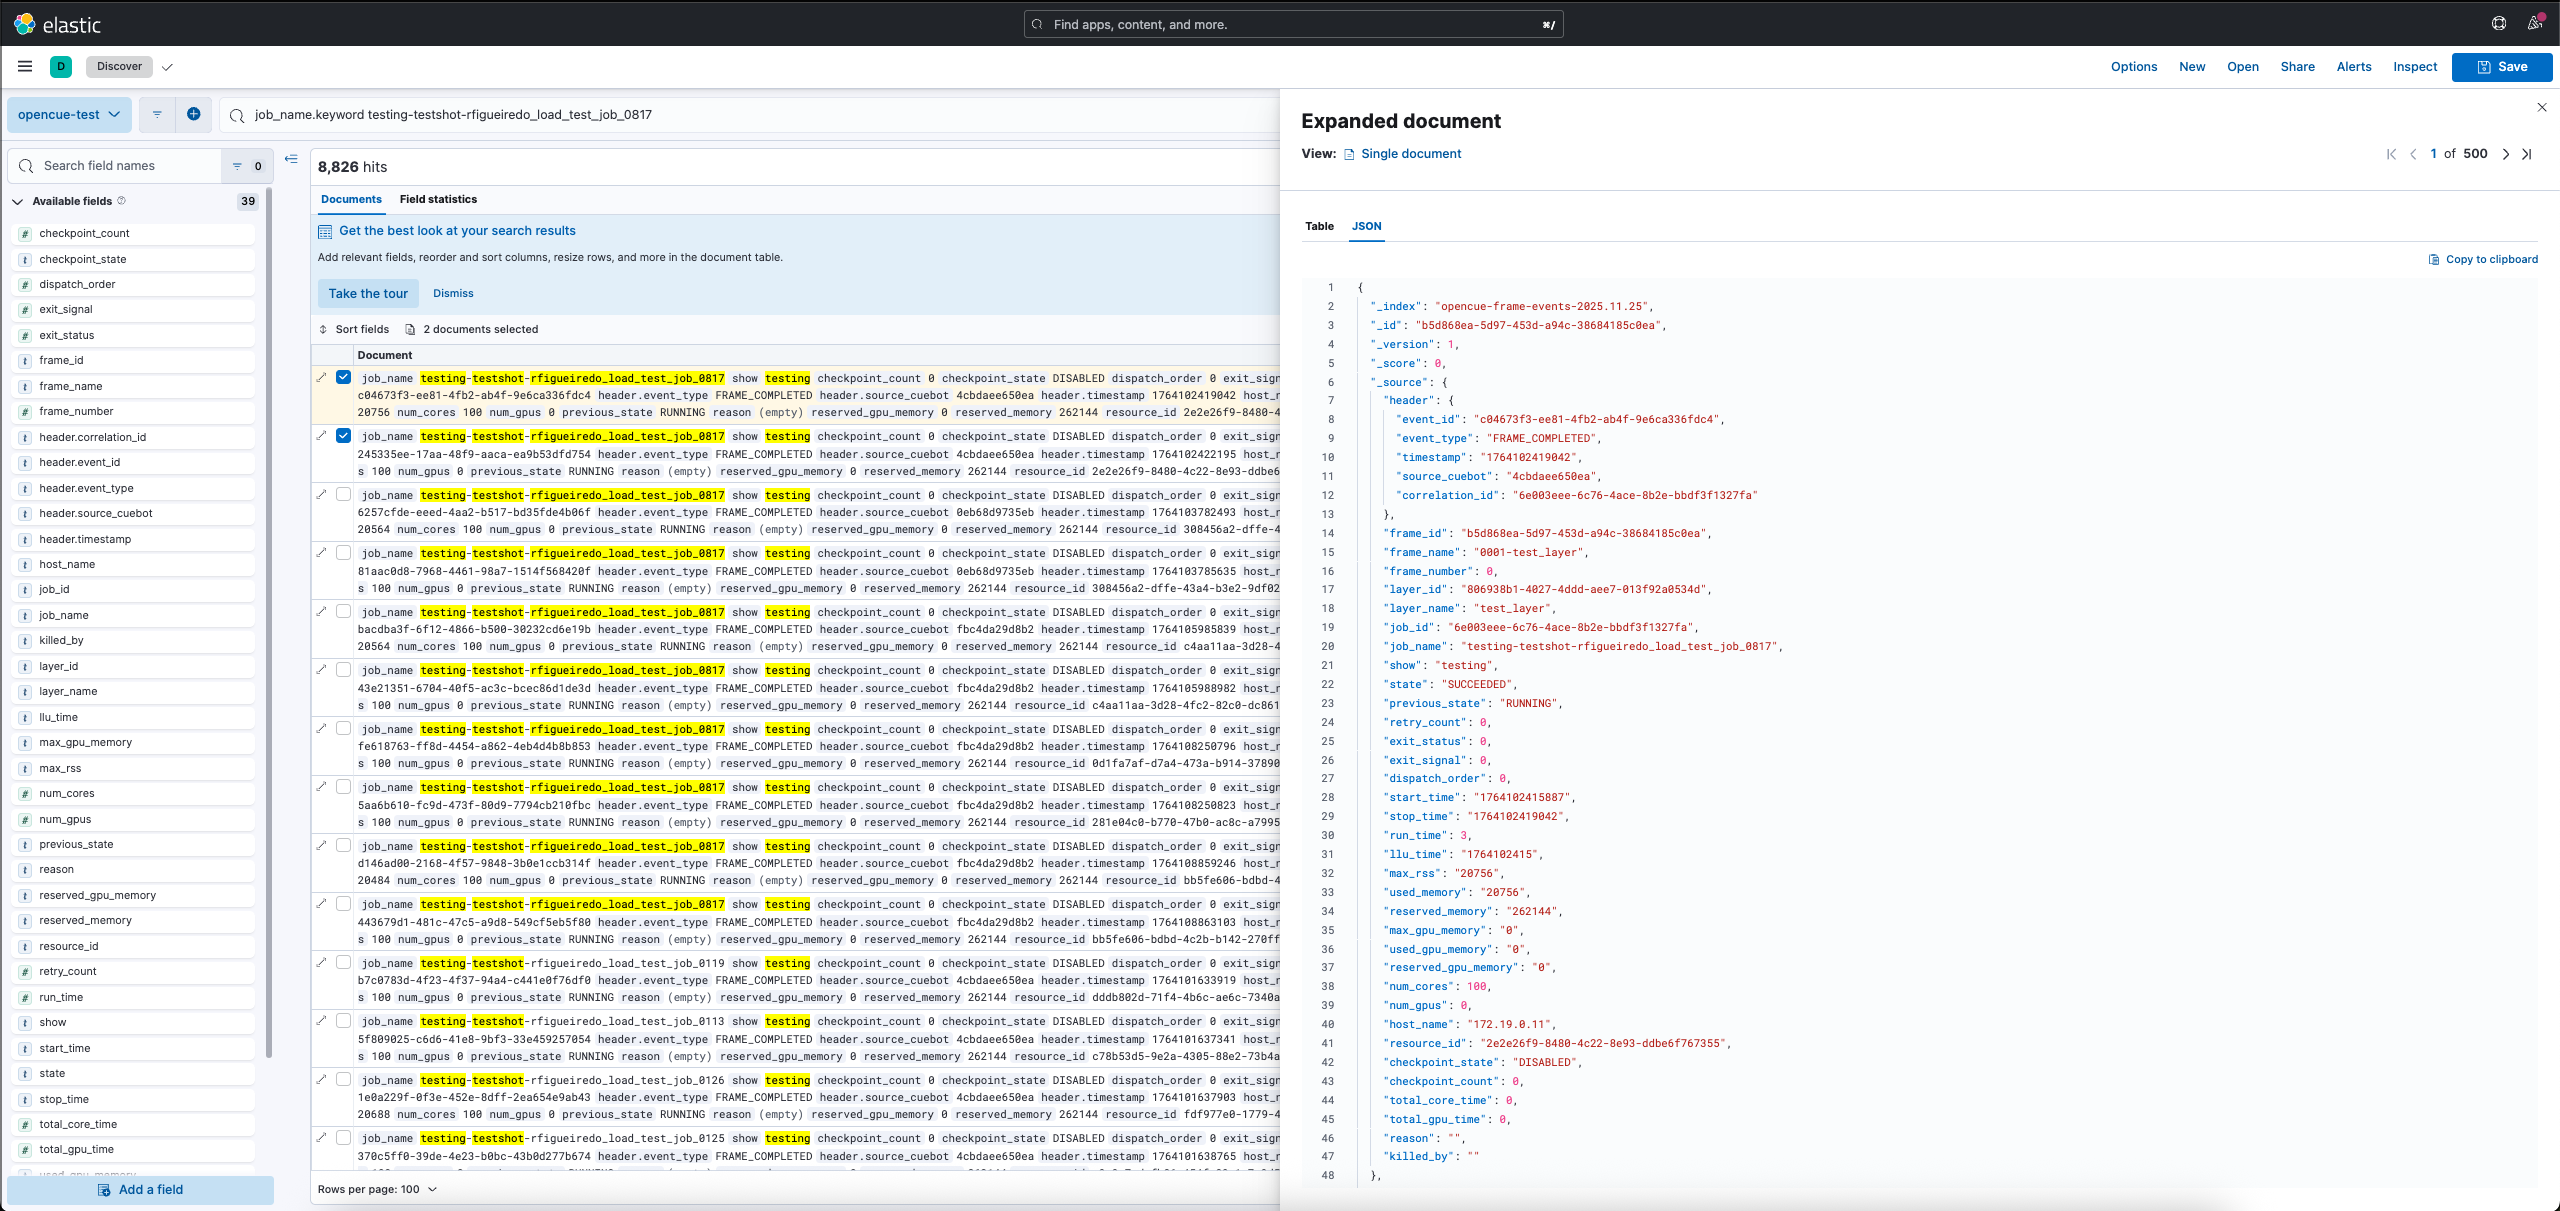
Querying events in Kibana
- Open Kibana at your configured URL (default:
http://localhost:5601) - Navigate to Discover
- Select the
opencue-*index pattern - Use KQL to search events
Example queries:
# Find all failed frames for a job
header.event_type: "FRAME_FAILED" AND job_name: "myshow*"

# Find frames that took longer than 1 hour
header.event_type: "FRAME_COMPLETED" AND run_time > 3600

# Find host down events
header.event_type: "HOST_DOWN" AND host_name: "render-*"

# Find all events for a specific show
show: "testing"
Creating visualizations
In Kibana, you can create:
- Time series: Frame completion over time
- Pie charts: Frame states distribution
- Data tables: Top failing jobs or layers
- Metrics: Average frame runtime
Retention and cleanup
Configure Elasticsearch index lifecycle management (ILM) to manage data retention:
{
  "policy": {
    "phases": {
      "hot": {
        "actions": {
          "rollover": {
            "max_age": "7d",
            "max_size": "50gb"
          }
        }
      },
      "delete": {
        "min_age": "30d",
        "actions": {
          "delete": {}
        }
      }
    }
  }
}
Prometheus metrics reference
Job metrics
| Metric | Type | Labels | Description |
|---|---|---|---|
cue_jobs_completed_total |
Counter | show | Total jobs completed |
cue_frames_completed_total |
Counter | state, show | Total frames completed |
cue_frame_runtime_seconds |
Histogram | show | Frame execution time |
cue_frame_memory_bytes |
Histogram | show | Frame memory usage |
Queue metrics
| Metric | Type | Labels | Description |
|---|---|---|---|
cue_dispatch_waiting_total |
Gauge | - | Dispatch queue size |
cue_dispatch_threads_total |
Gauge | - | Active dispatch threads |
cue_booking_waiting_total |
Gauge | - | Booking queue size |
cue_report_executed_total |
Gauge | - | Host reports processed |
Host metrics
| Metric | Type | Labels | Description |
|---|---|---|---|
cue_host_reports_received_total |
Counter | facility | Host reports received |
Best practices
Dashboard organization
- Create separate dashboards for operations, capacity planning, and debugging
- Use template variables to filter by show, facility, or time range
- Set appropriate refresh intervals (5s for real-time, 1m for overview)
Alert tuning
- Start with conservative thresholds and adjust based on baseline
- Use
forclauses to avoid alerting on transient spikes - Include runbook links in alert messages
Data retention
- Keep high-resolution metrics for 2-4 weeks
- Downsample older data for long-term trends
- Archive raw events to cold storage if needed for compliance
What’s next?
- Monitoring developer guide - Extend and customize the monitoring system
- Render farm monitoring concepts - Understand the monitoring architecture