Monitoring with Prometheus, Loki, and Grafana
Configuring OpenCue with external monitoring services
This page describes how to stand up a sample OpenCue deployment configured to send data to external monitoring services.
The sandbox deployment described here utilizes:
- Prometheus for collecting metrics from the OpenCue database and scheduler.
- Loki for collecting logs from all OpenCue components.
- Grafana to provide an interface for querying and displaying the data send by the others.
Before you begin
- Follow our quick start guide, which will walk you through standing up a basic OpenCue deployment using Docker compose. This guide builds on the quick start, and they share the same prerequisites.
- Install the Loki Docker driver.
Deploying OpenCue with external monitoring services
You deploy the sandbox environment using
Docker Compose profiles. The monitoring profile runs the following services alongside the core OpenCue stack:
- a PostgreSQL exporter for Prometheus
- a Prometheus instance for metrics storage
- a Loki instance for log storage
- a Grafana instance
To deploy the sandbox environment:
- If you followed the first quick start before this one, ensure all resources are cleaned up .
- Start the Terminal app.
-
Change to the root of the OpenCue source code directory:
cd OpenCue -
To deploy the sandbox environment with monitoring, run the following command:
docker compose --profile monitoring upThe command produces a lot of output. When the setup process completes, you see output similar to the following example:
rqd-1     | WARNING   openrqd-__main__  : RQD Starting Up
rqd-1     | WARNING   openrqd-rqcore    : RQD Started
Leave this shell running in the background.
Using Grafana to view exported data
To view the data exported by the monitoring stack, log into the Grafana endpoint provided by the sandbox environment.
- Open your browser and visit http://localhost:3001/.
- Log in with the default admin account:
- User: admin
- Password: admin
- Change the
adminpassword if prompted. -
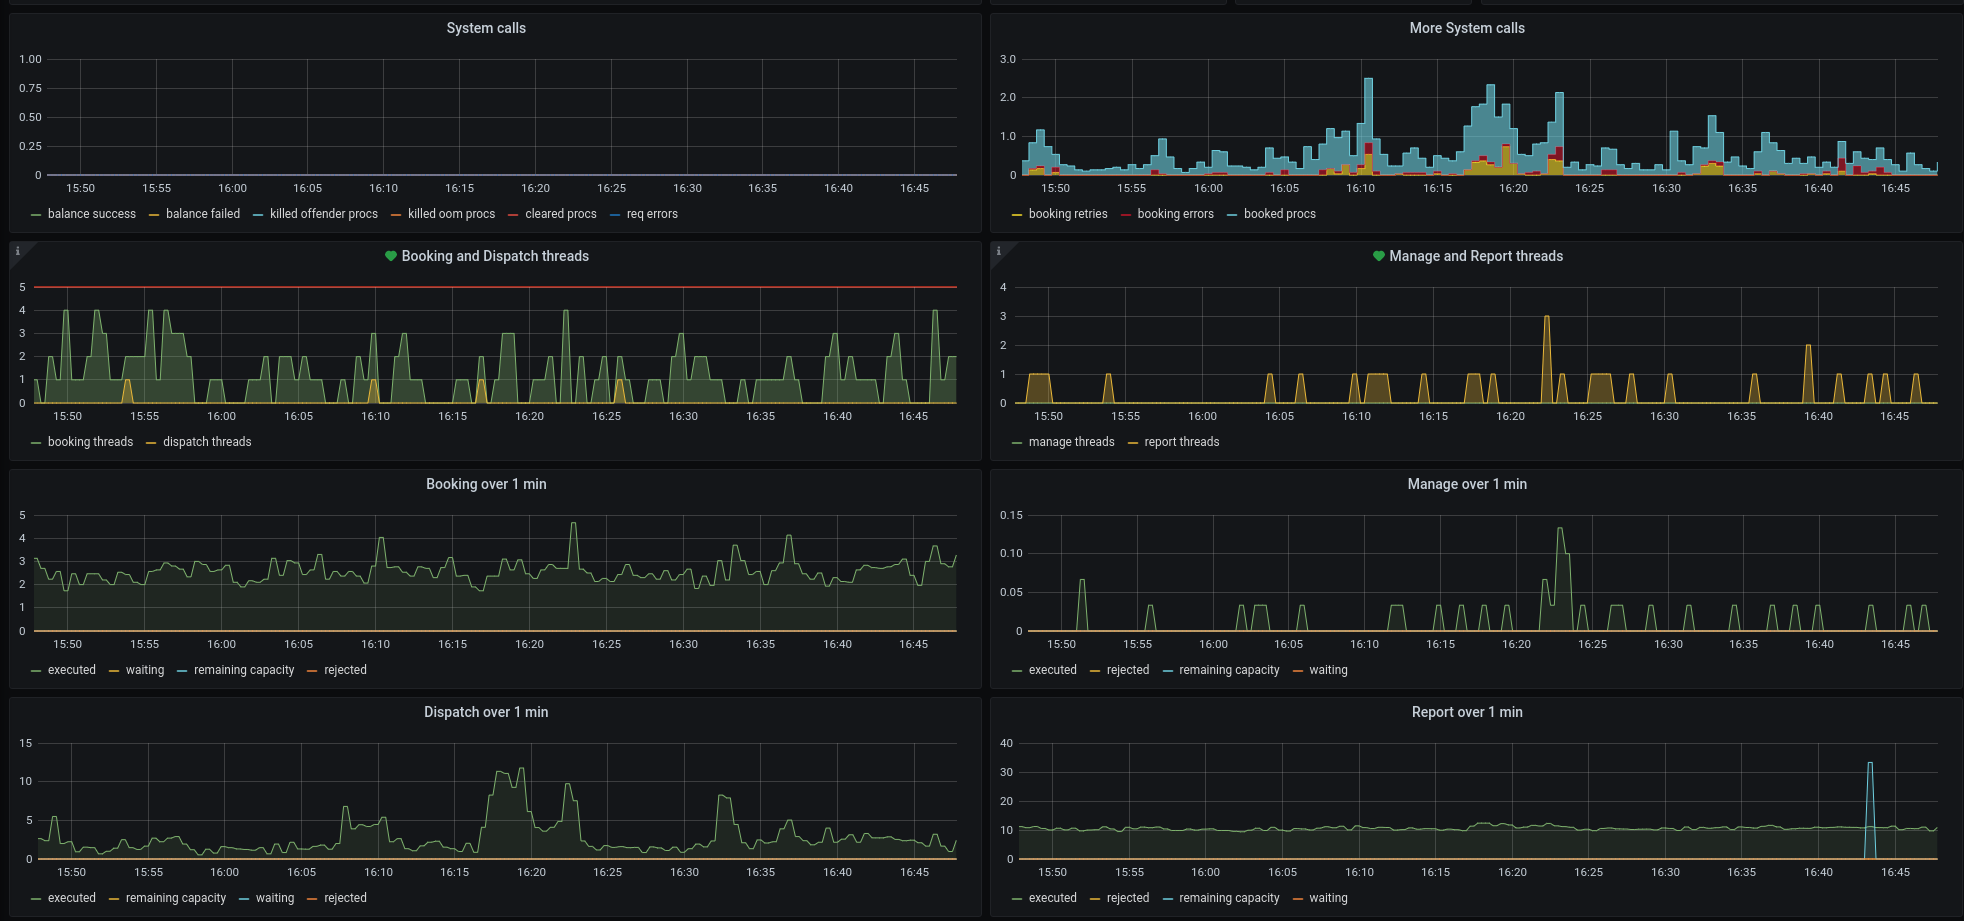
To view the sample dashboards included with the sandbox, click Dashboards > Manage.
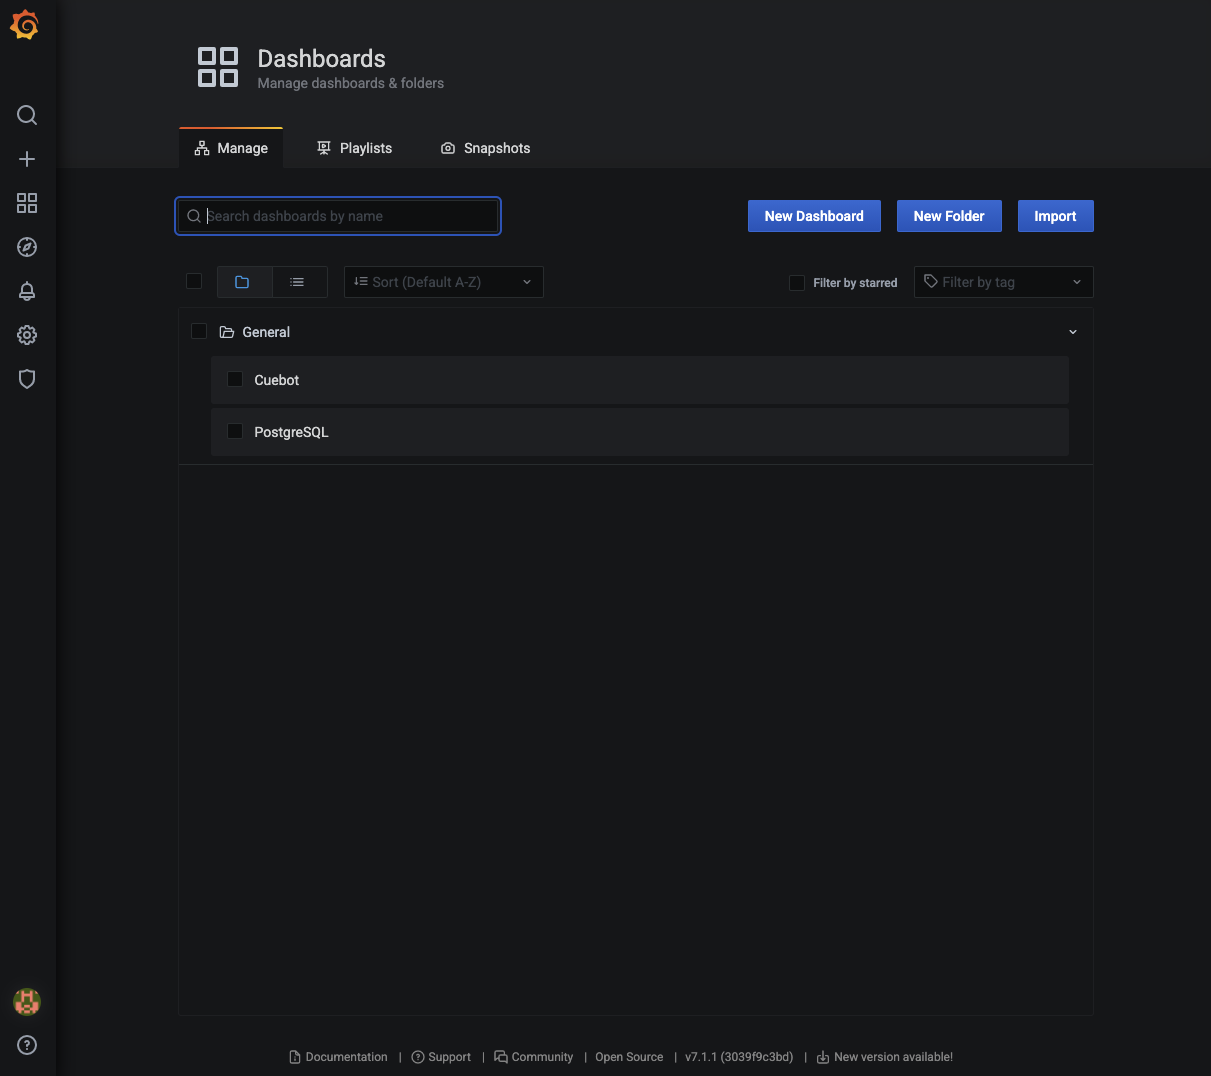
Once displayed, these dashboards will show metrics exported from Cuebot and the PostgreSQL database:
Stopping and deleting the sandbox environment
To delete the resources you created in this guide, run the following commands from the second shell:
-
To stop the sandbox environment, run the following command:
docker compose --profile all down -
To also remove all data volumes:
docker compose --profile all down -v
What’s next?
- Explore Grafana’s functionality using the Grafana Getting Started guide.
- Install the full OpenCue infrastructure.