Render farm monitoring
Understanding the OpenCue render farm monitoring system
OpenCue provides a comprehensive monitoring system for tracking render farm operations, collecting metrics, and analyzing historical data. This system enables real-time visibility into job execution, resource utilization, and system health.
Overview
The monitoring system is built on an event-driven architecture that captures lifecycle events from jobs, layers, frames, hosts, and processes. These events can be:
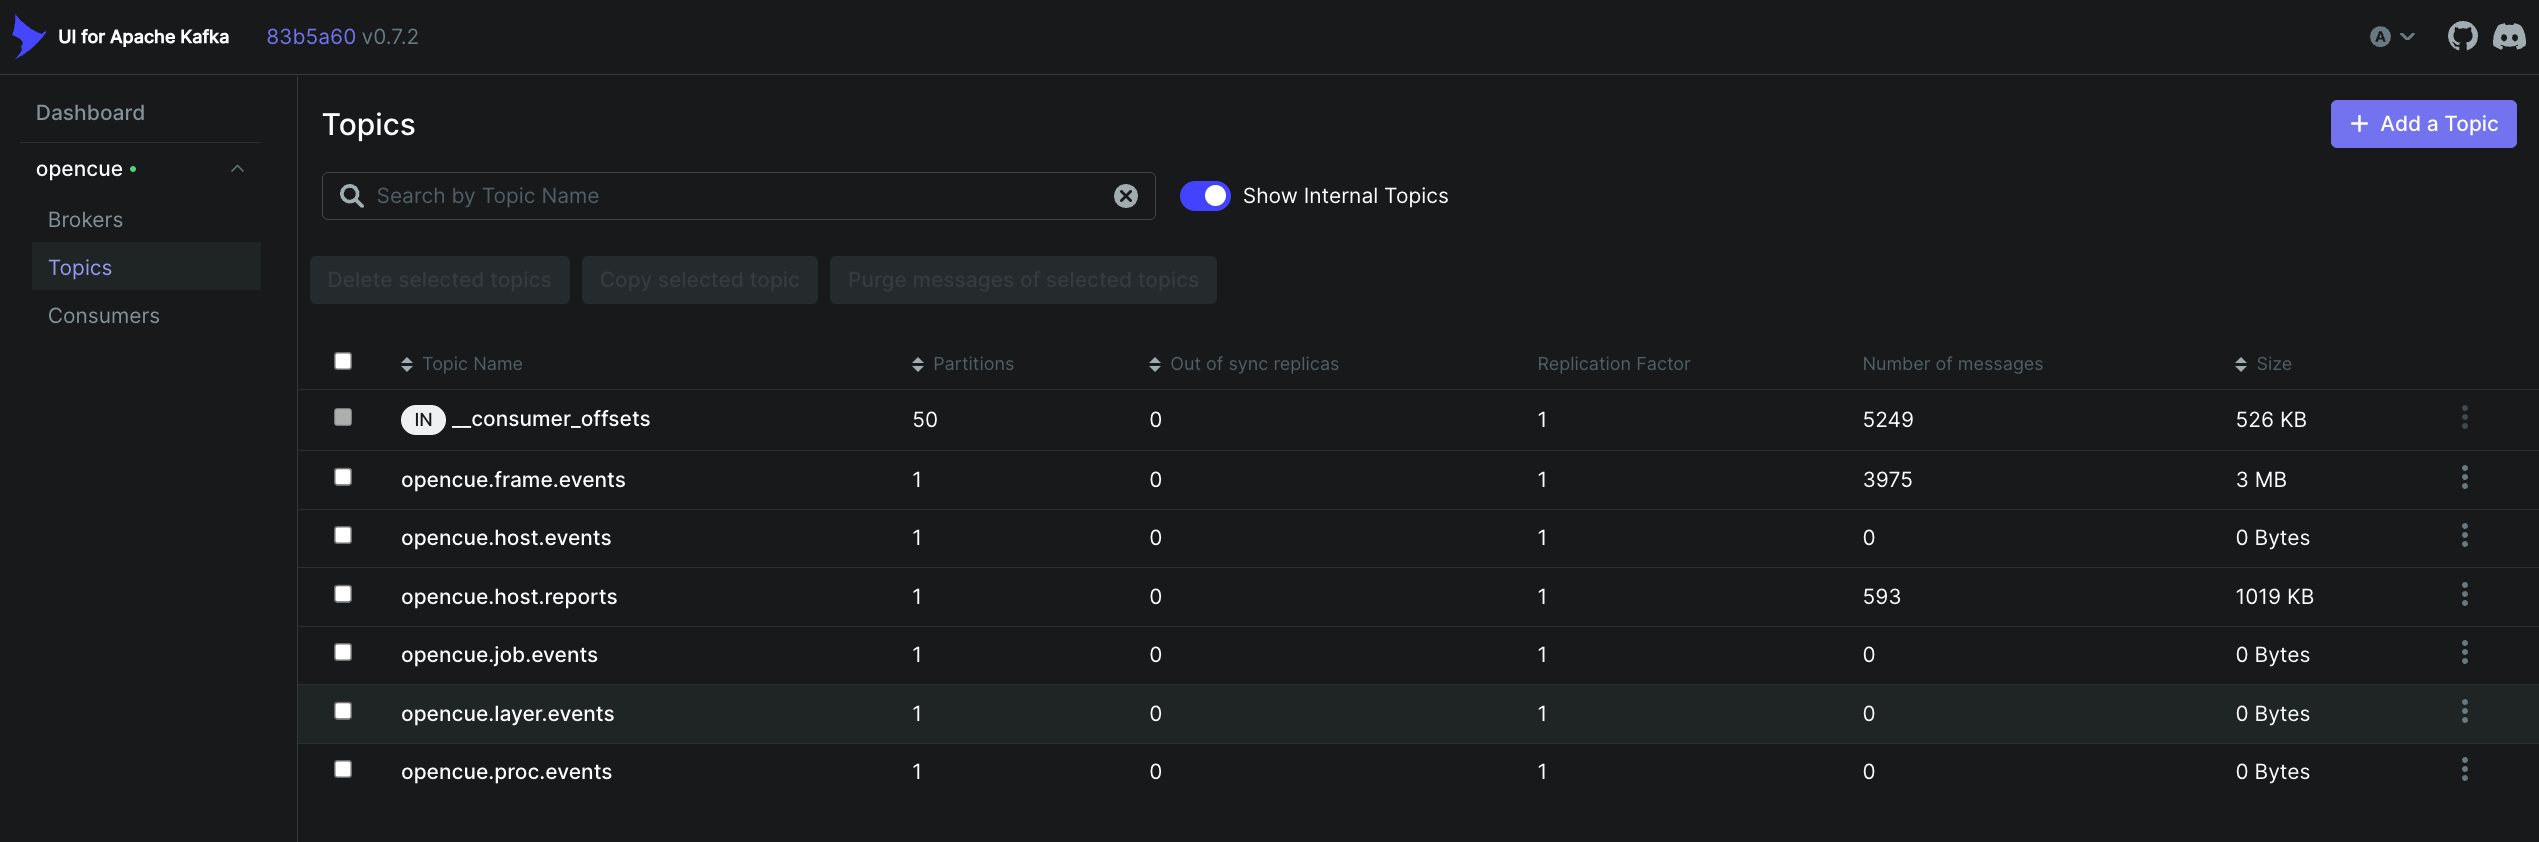
- Published to Kafka for real-time streaming and integration with external systems
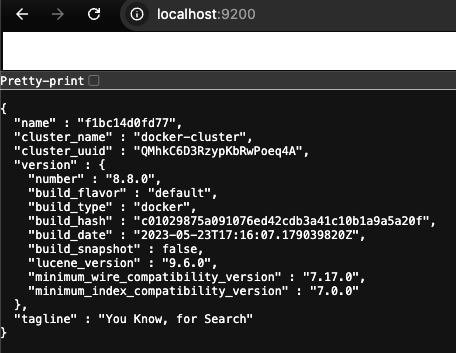
- Stored in Elasticsearch for historical analysis and querying
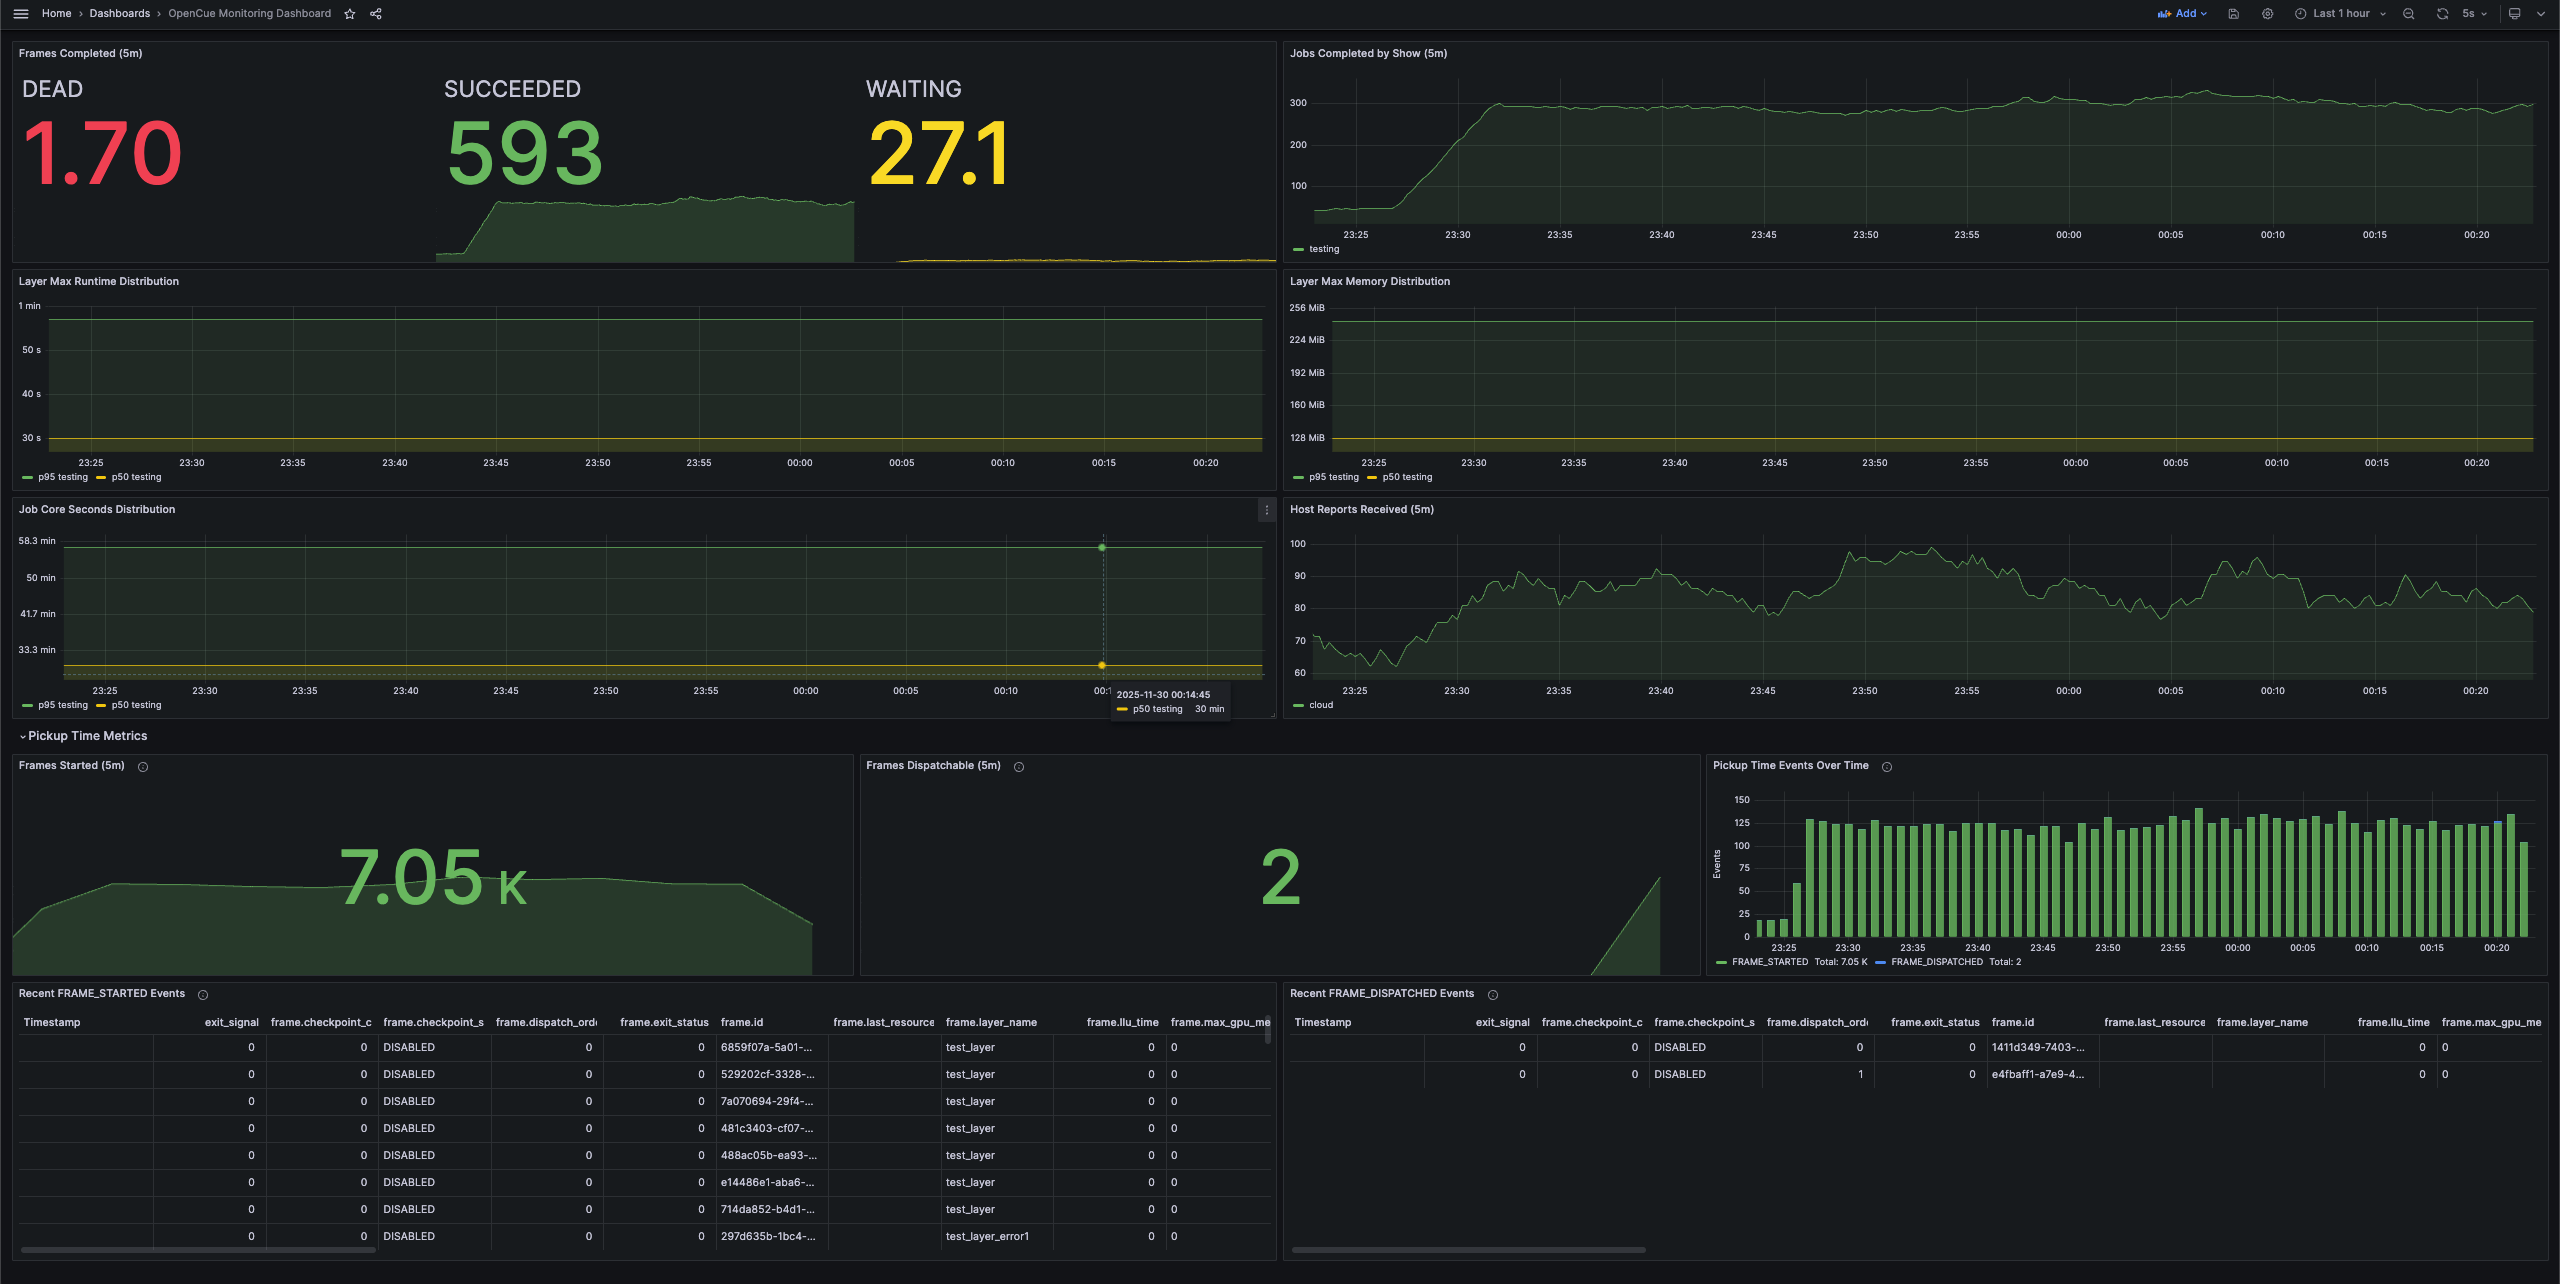
- Exposed as Prometheus metrics for real-time dashboards and alerting
Architecture
The monitoring system uses a decoupled architecture:
┌────────────────────────────────────────────────────────────────────────────┐
│                                Cuebot                                      │
│                                                                            │
│  ┌─────────────┐     ┌─────────────────────┐                               │
│  │   Service   │────>│ KafkaEventPublisher │──────────> Kafka              │
│  │   Layer     │     └─────────────────────┘               │               │
│  └─────────────┘              │                            │               │
│        │                      v                            │               │
│        └─────────────>┌──────────────┐                     │               │
│                       │  Prometheus  │                     │               │
│                       │   Metrics    │                     │               │
│                       └──────────────┘                     │               │
└────────────────────────────────────────────────────────────│───────────────┘
                                                             │
                                                             v
┌────────────────────────────────────────────────────────────────────────────┐
│                      monitoring-indexer (Rust)                               │
│                                                                            │
│  ┌───────────────────┐         ┌─────────────────────────┐                 │
│  │   Kafka Consumer  │────────>│   Elasticsearch Client  │                 │
│  │     (rdkafka)     │         │     (bulk indexing)     │                 │
│  └───────────────────┘         └─────────────────────────┘                 │
│                                            │                               │
└────────────────────────────────────────────│───────────────────────────────┘
                                             v
                                       Elasticsearch
Event publishing (Kafka)
Cuebot publishes events to Apache Kafka topics when significant state changes occur:
| Topic | Description |
|---|---|
opencue.job.events |
Job lifecycle events (created, started, finished, killed) |
opencue.layer.events |
Layer state changes |
opencue.frame.events |
Frame execution events (started, completed, failed, retried) |
opencue.host.events |
Host state changes (up, down, locked, nimby) |
opencue.proc.events |
Process allocation and deallocation events |
Events are published asynchronously to avoid impacting render farm performance. A bounded queue ensures the system remains responsive even under high load.
Historical storage (Elasticsearch)
A standalone Rust-based service (monitoring-indexer) consumes events from Kafka and indexes them into Elasticsearch for long-term storage and analysis. This decoupled architecture enables:
- Historical queries: Search for jobs, frames, or hosts by any attribute
- Trend analysis: Track metrics over time (job completion rates, failure patterns)
- Capacity planning: Analyze resource utilization patterns
- Debugging: Investigate issues by examining historical event sequences
Elasticsearch indices are organized by event type and time-based partitioning for efficient querying.
Metrics collection (Prometheus)
Cuebot exposes a /metrics endpoint compatible with Prometheus. Key metrics include:
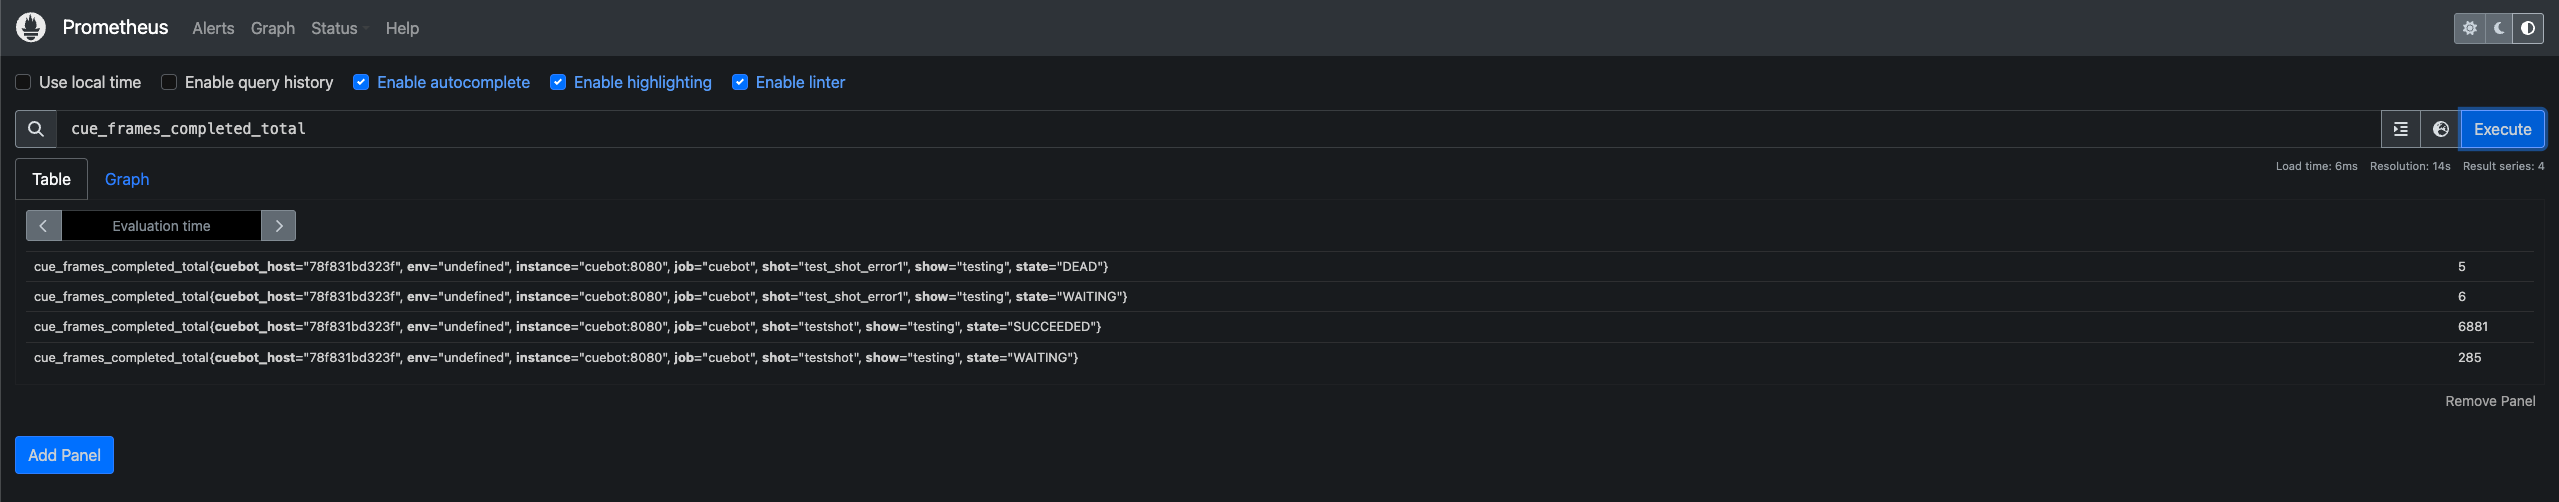
Job and frame metrics:
cue_frames_completed_total- Counter of completed frames by statecue_jobs_completed_total- Counter of completed jobs by showcue_frame_runtime_seconds- Histogram of frame execution timescue_frame_memory_bytes- Histogram of frame memory usage
Queue metrics:
cue_dispatch_waiting_total- Tasks waiting in dispatch queuecue_booking_waiting_total- Tasks waiting in booking queuecue_report_executed_total- Host reports processed
Event types
Job events
Job events capture the complete lifecycle of rendering jobs:
- JOB_CREATED: A new job was submitted to the queue
- JOB_STARTED: The job began executing (first frame dispatched)
- JOB_FINISHED: All frames completed successfully
- JOB_KILLED: The job was manually terminated
- JOB_PAUSED: The job was paused
- JOB_RESUMED: The job was resumed from paused state
Frame events
Frame events track individual frame execution:
- FRAME_STARTED: A frame began rendering on a host
- FRAME_COMPLETED: A frame finished successfully
- FRAME_FAILED: A frame failed with an error
- FRAME_RETRIED: A failed frame was retried
- FRAME_EATEN: A frame was marked as complete without rendering
Host events
Host events monitor render node status:
- HOST_UP: A host came online
- HOST_DOWN: A host went offline
- HOST_LOCKED: A host was locked for maintenance
- HOST_UNLOCKED: A host was unlocked
- HOST_NIMBY_LOCKED: A host entered NIMBY mode
- HOST_NIMBY_UNLOCKED: A host exited NIMBY mode
Configuration
Cuebot configuration
Enable Kafka and Prometheus through Cuebot properties:
# Kafka event publishing
monitoring.kafka.enabled=true
monitoring.kafka.bootstrap.servers=kafka:9092

# Prometheus metrics
metrics.prometheus.collector=true
monitoring-indexer configuration
The standalone Rust indexer (rust/crates/monitoring-indexer/) is configured via environment variables or CLI arguments:
# Using environment variables
export KAFKA_BOOTSTRAP_SERVERS=kafka:9092
export ELASTICSEARCH_URL=http://elasticsearch:9200
monitoring-indexer

# Or using CLI arguments
monitoring-indexer \
  --kafka-servers kafka:9092 \
  --elasticsearch-url http://elasticsearch:9200 \
  --index-prefix opencue
Each component can be enabled or disabled independently based on your infrastructure needs.
What’s next?
- Quick start: Setting up monitoring - Deploy the monitoring stack
- Monitoring user guide - Configure dashboards and alerts
- Monitoring developer guide - Extend and customize the monitoring system